Full Report
The numbers behind Fiserv, Inc.: as-reported financial statements and company metrics for FY2021–FY2025, traced to the source filings, opened with the share-price history those statements have to justify. Every linked figure opens the exact page of the filing it was printed on, with the statement row highlighted. Amounts in US$ millions unless noted.
Reading notes: Display units are US$ millions, as printed on every Fiserv consolidated statement ('In millions, except per share data'). Per-share and share-count rows are exempt from that scale. Each fiscal year's income statement, balance sheet and cash-flow figures are cited to that year's own Form 10-K (FY2021-FY2025), so every column is a first-reported figure rather than a later comparative. Revenue by Business Line and reportable segment operating income are cited to the FY2025 Form 10-K (FY2025) and the FY2024 Form 10-K (FY2024, FY2023, FY2022). FY2021 is blank in both tables: Fiserv reorganised from three segments (Merchant Acceptance, Payments and Network, Financial Technology) into two (Merchant Solutions, Financial Solutions) in 2024, and no filing in the corpus restates FY2021 onto the current basis. The FY2024 Form 10-K labels the segment subtotals 'Total Merchant segment revenue' and 'Total Financial segment revenue'; the FY2025 Form 10-K adds 'Solutions'. Row labels use the FY2025 wording; each quote is verbatim from the page cited.
Share Price — Full Available History — 37 Years
The stock closed at $55.67 on Jul 29, 2026 — up 11,697% over the window shown (+13.9% a year), trading between $0.44 and $237.79. At that close the stock trades at 8.8× FY2025 diluted EPS as reported below.
Source: market price feed, monthly closes, sampled from 9,211 source observations, Jan 1990–Jul 2026. Price return only, excludes dividends.
Market capitalization $24.9bn.
Market cap = 447.8M shares outstanding × the Jul 29, 2026 close of $55.67. Market-derived, shown without filing links.
FY2025 at a Glance
Revenue (US$ millions)
Operating income (US$ millions)
Net income (US$ millions)
Diluted EPS
Source: FY2025 consolidated statements [1] [2] [3] [4]. Click any linked figure to open the filing page with the row highlighted.
Revenue by Business Line
| Revenue by Business Line | FY2021 | FY2022 | FY2023 | FY2024 | FY2025 |
|---|---|---|---|---|---|
| Small Business | — | 4,920 | 5,664 | 6,357 | 6,795 |
| Enterprise | — | 1,811 | 1,933 | 2,163 | 2,256 |
| Processing | — | 1,152 | 1,125 | 1,111 | 1,089 |
| Total Merchant Solutions segment revenue | — | 7,883 | 8,722 | 9,631 | 10,140 |
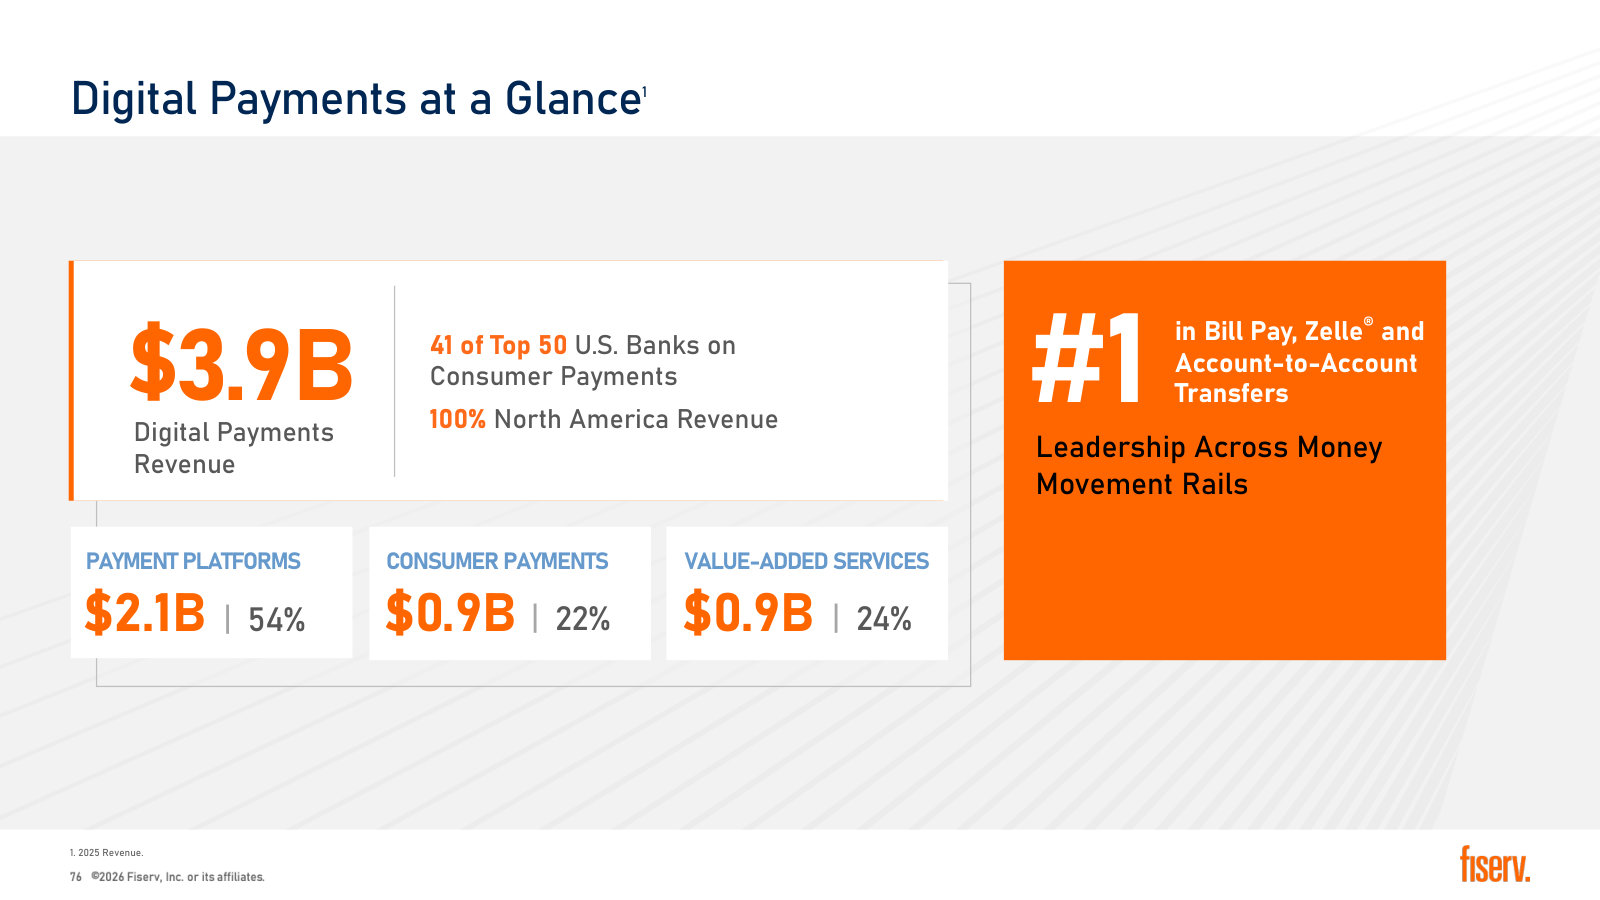
| Digital Payments | — | 3,370 | 3,655 | 3,869 | 3,945 |
| Issuing | — | 2,801 | 3,011 | 3,112 | 3,284 |
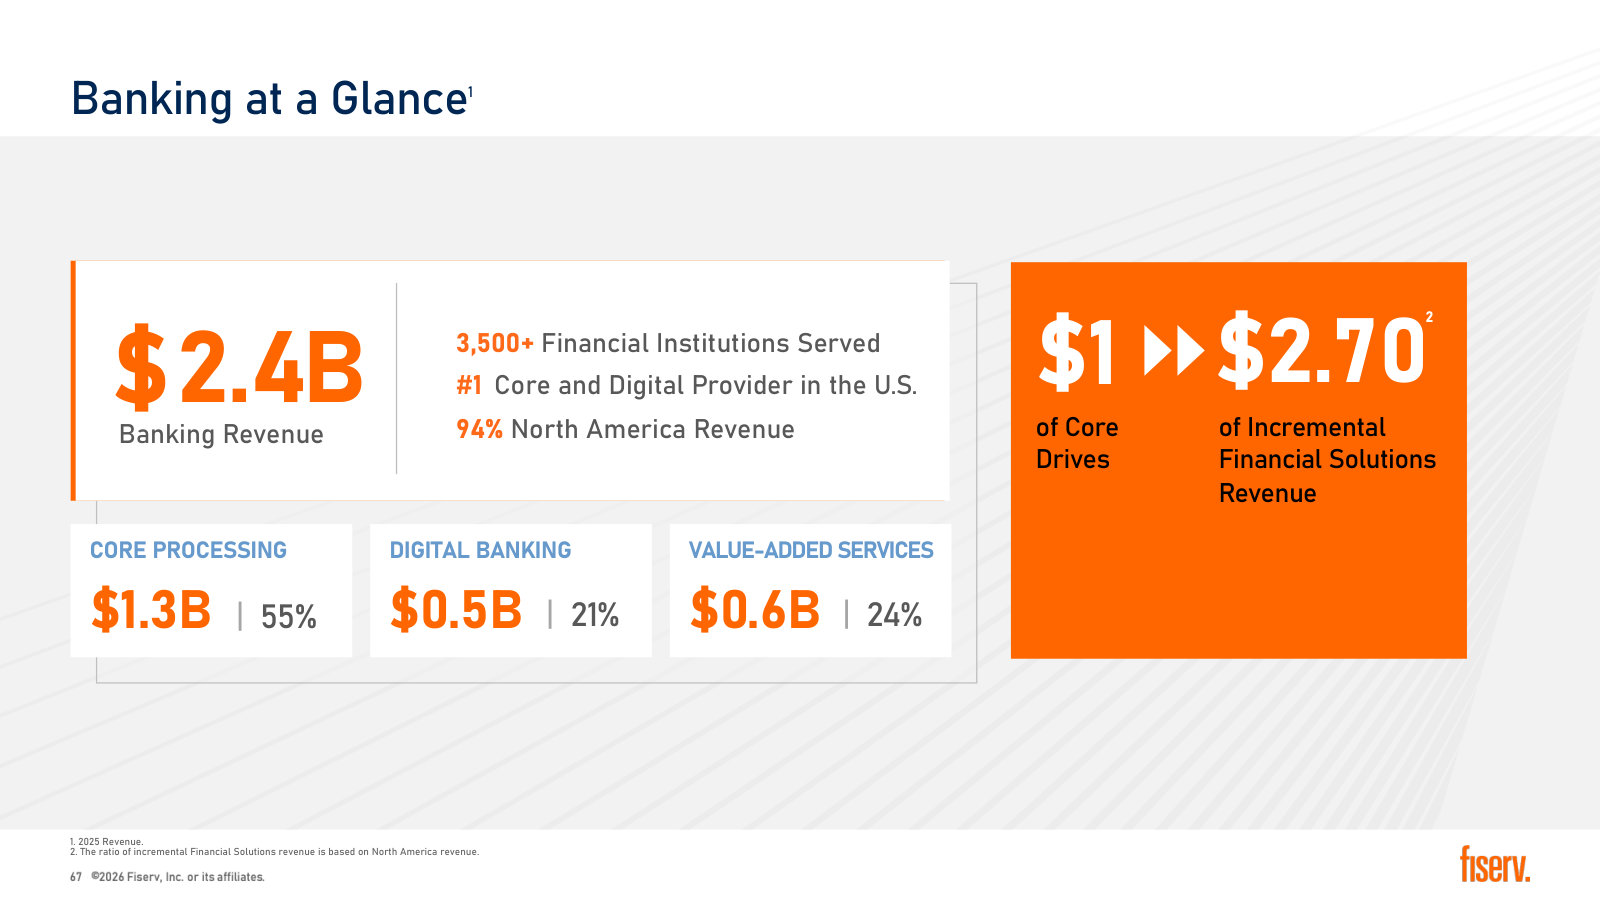
| Banking | — | 2,510 | 2,435 | 2,496 | 2,435 |
| Total Financial Solutions segment revenue | — | 8,681 | 9,101 | 9,477 | 9,664 |
| Corporate and Other | — | 1,173 | 1,270 | 1,348 | 1,389 |
| Total Revenue | — | 17,737 | 19,093 | 20,456 | 21,193 |
| Total Revenue growth, derived | — | — | +7.6% | +7.1% | +3.6% |
Source: Note 3 Revenue Recognition, Disaggregation of Revenue (FY2025 and FY2024 Forms 10-K) [5] [6]. Click any linked figure to open the filing page with the row highlighted.
Reportable Segment Operating Income
| Reportable Segment Operating Income | FY2021 | FY2022 | FY2023 | FY2024 | FY2025 |
|---|---|---|---|---|---|
| Merchant Solutions | — | 2,441 | 2,974 | 3,561 | 3,502 |
| Financial Solutions | — | 3,806 | 4,178 | 4,485 | 4,380 |
| Total reportable segment operating income | — | 6,247 | 7,152 | 8,046 | 7,882 |
| Corporate and Other operating loss | — | (2,507) | (2,138) | (2,167) | (2,064) |
Source: Business Segment Information note (FY2025 and FY2024 Forms 10-K) [7] [8]. Click any linked figure to open the filing page with the row highlighted.
Income Statement
Source: Consolidated Statements of Income, Form 10-K for each fiscal year [1] [2] [3] [4]. Click any linked figure to open the filing page with the row highlighted.
Columns marked E are consensus analyst estimates from S&P Capital IQ (CapIQ), shown alongside reported results for direct comparison; they are not company guidance.
Estimate source: S&P Capital IQ (CapIQ) consensus, as of 2026-07-31. Estimate figures are S&P Capital IQ consensus (vendor data — no filing page links). EPS and net income use the normalized (adjusted) consensus where the street reports it. Line-item analyst models (segments, drivers, KPIs) are in the Visible Alpha tab.
Balance Sheet
Source: Consolidated Balance Sheets, Form 10-K for each fiscal year [9] [10] [11] [12]. Click any linked figure to open the filing page with the row highlighted.
Cash Flow
Source: Consolidated Statements of Cash Flows, Form 10-K for each fiscal year [13] [14] [15] [16]. Click any linked figure to open the filing page with the row highlighted.
Organic Growth and Adjusted Profitability
| Organic Growth and Adjusted Profitability | FY2021 | FY2022 | FY2023 | FY2024 | FY2025 |
|---|---|---|---|---|---|
| Organic revenue growth — total company | 11.0% | 11.0% | 12.0% | 16.0% | 4.0% |
| Adjusted operating income | 5,212 | 5,882 | 6,729 | 7,537 | 7,398 |
| Adjusted operating margin | 33.9% | 35.1% | 37.7% | 39.4% | 37.4% |
| Adjusted earnings per share | 5.58 | 6.49 | 7.52 | 8.80 | 8.64 |
| Free cash flow | 3,532 | 3,515 | 4,016 | 5,233 | 4,435 |
Source: company filings [17] [18] [19] [20]. Click any linked figure to open the filing page with the row highlighted.
Reported Operating Margin — Company and Segments
| Reported Operating Margin — Company and Segments | FY2021 | FY2022 | FY2023 | FY2024 | FY2025 |
|---|---|---|---|---|---|
| Operating margin — total company | 14.1% | 21.1% | 26.3% | 28.7% | 27.5% |
| Operating margin — Merchant Solutions | — | — | 34.1% | 37.0% | 34.5% |
| Operating margin — Financial Solutions | — | — | 45.9% | 47.3% | 45.3% |
Source: company filings [19] [21] [22]. Click any linked figure to open the filing page with the row highlighted.
Clover and Small Business
| Clover and Small Business | FY2021 | FY2022 | FY2023 | FY2024 | FY2025 |
|---|---|---|---|---|---|
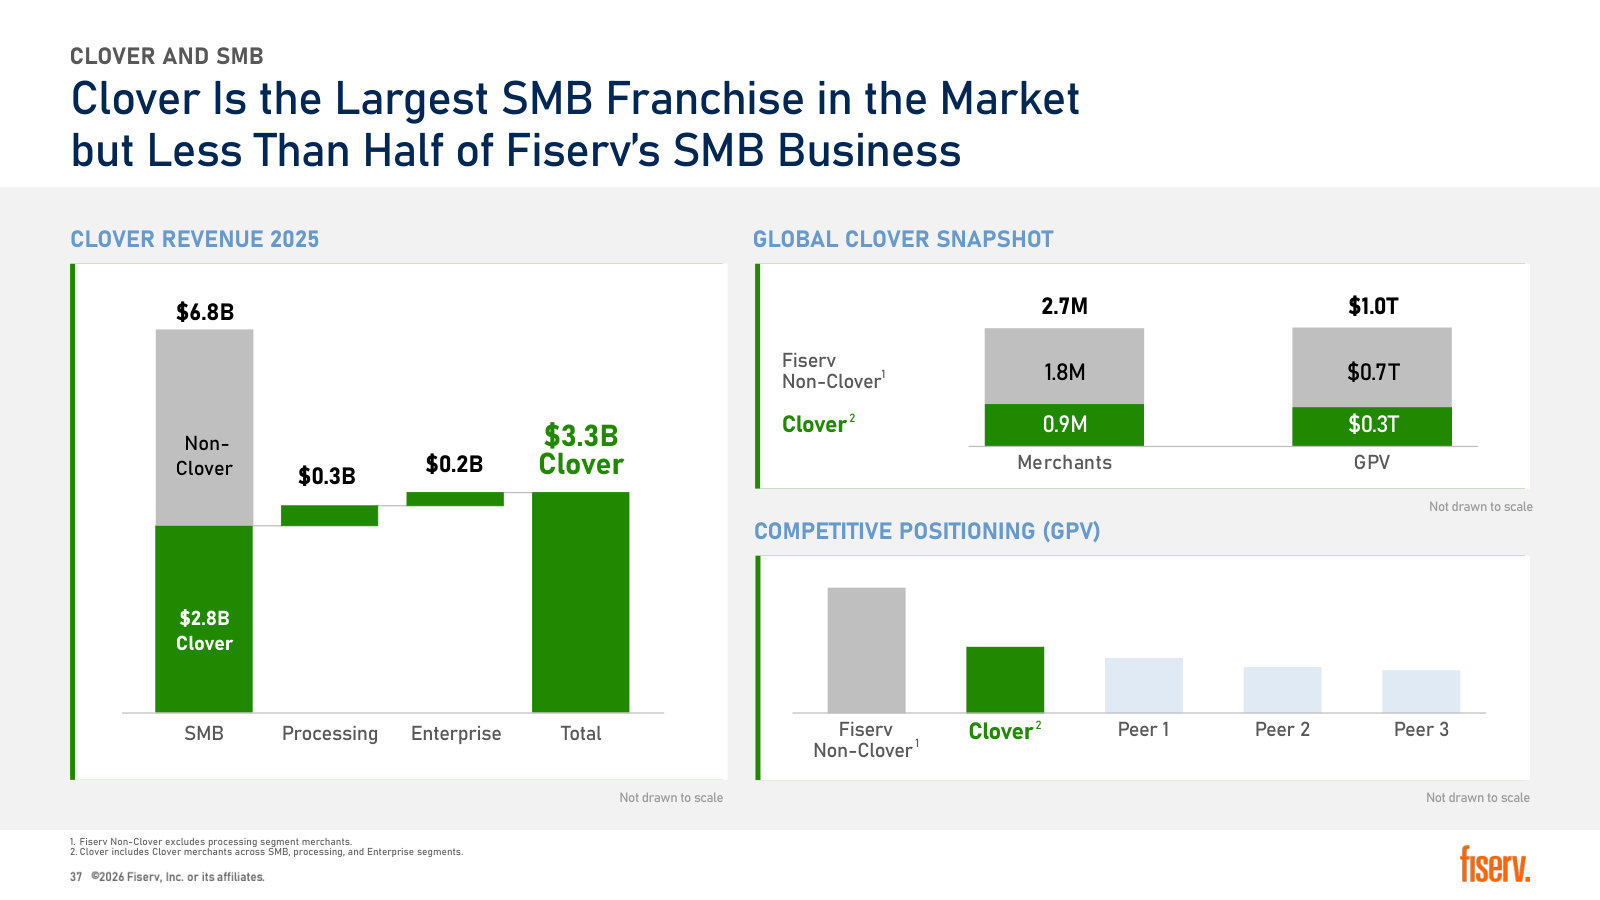
| Clover revenue | — | — | — | 2,700 | 3,300 |
| Clover revenue growth | — | — | 25.0% | 29.0% | 23.0% |
| Clover value-added services penetration (Q4, % of Clover revenue) | — | 16.0% | 19.0% | 22.0% | 27.0% |
| Clover annualized payment volume growth (Q4) | — | — | 17.0% | 14.0% | — |
Source: company filings [23] [24] [25]. Click any linked figure to open the filing page with the row highlighted.
Revenue Mix and Capital Intensity
| Revenue Mix and Capital Intensity | FY2021 | FY2022 | FY2023 | FY2024 | FY2025 |
|---|---|---|---|---|---|
| Processing and services — % of total revenue | 82.0% | 81.5% | 81.9% | 81.3% | 79.6% |
| U.S. and Canada — % of total revenue | 86.0% | 86.0% | 85.0% | 85.0% | 84.0% |
| International — % of total revenue | 14.0% | 14.0% | 15.0% | 15.0% | 16.0% |
| Capital expenditures — % of total revenue | 7% | 8% | 7% | 8% | 8% |
Source: company filings [26] [27] [28] [29]. Click any linked figure to open the filing page with the row highlighted.
Franchise Scale (2026 Investor Day)
| Franchise Scale (2026 Investor Day) | FY2021 | FY2022 | FY2023 | FY2024 | FY2025 |
|---|---|---|---|---|---|
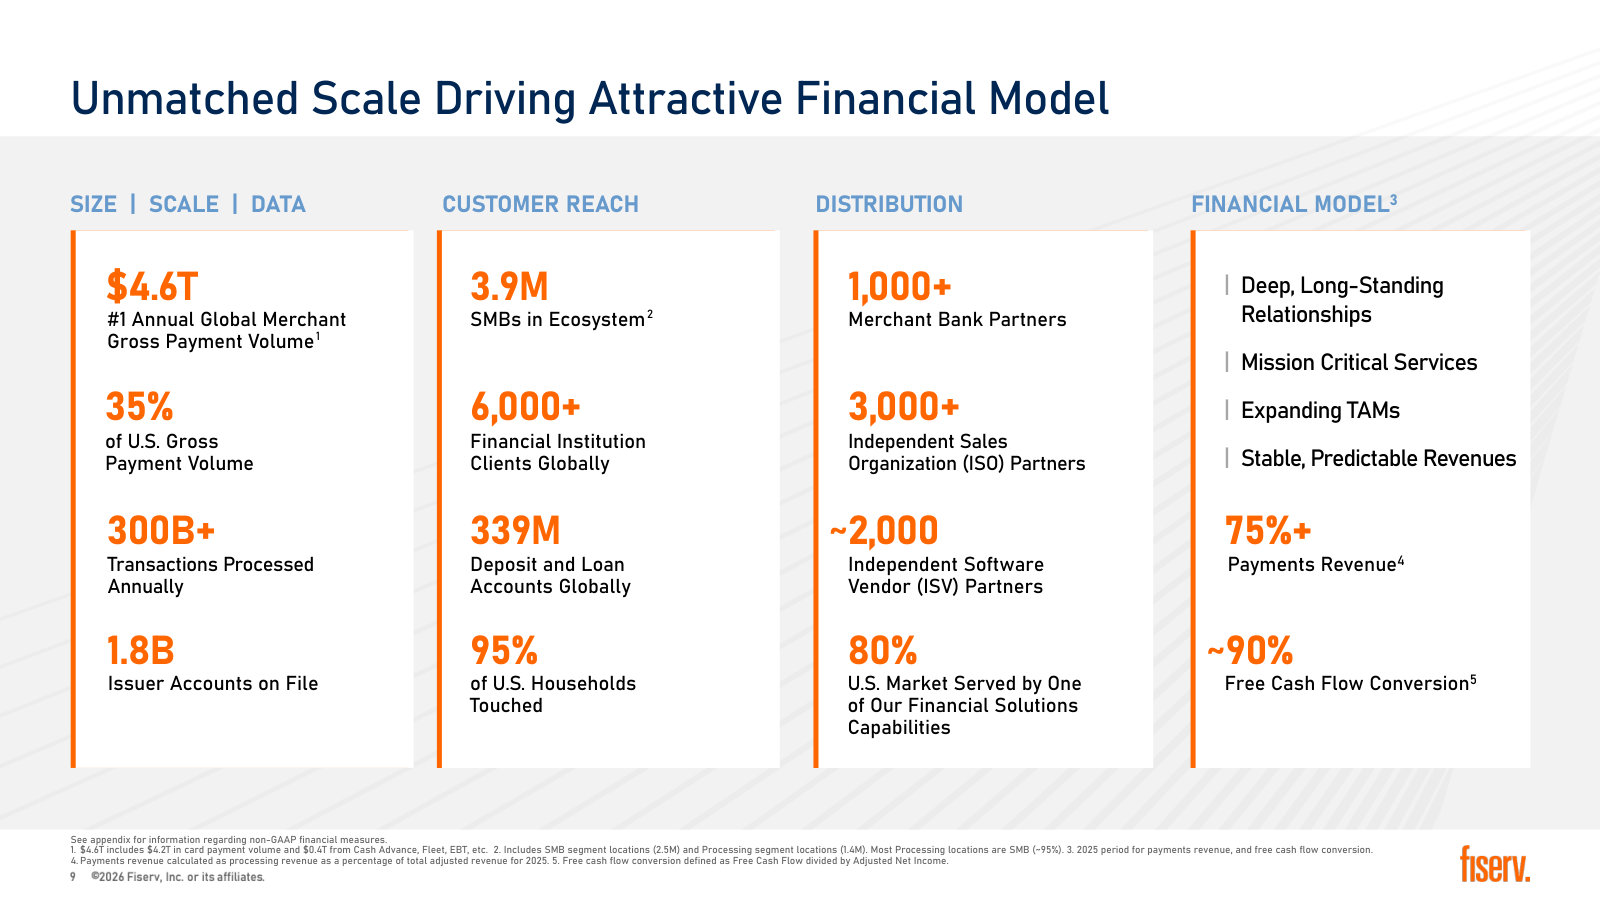
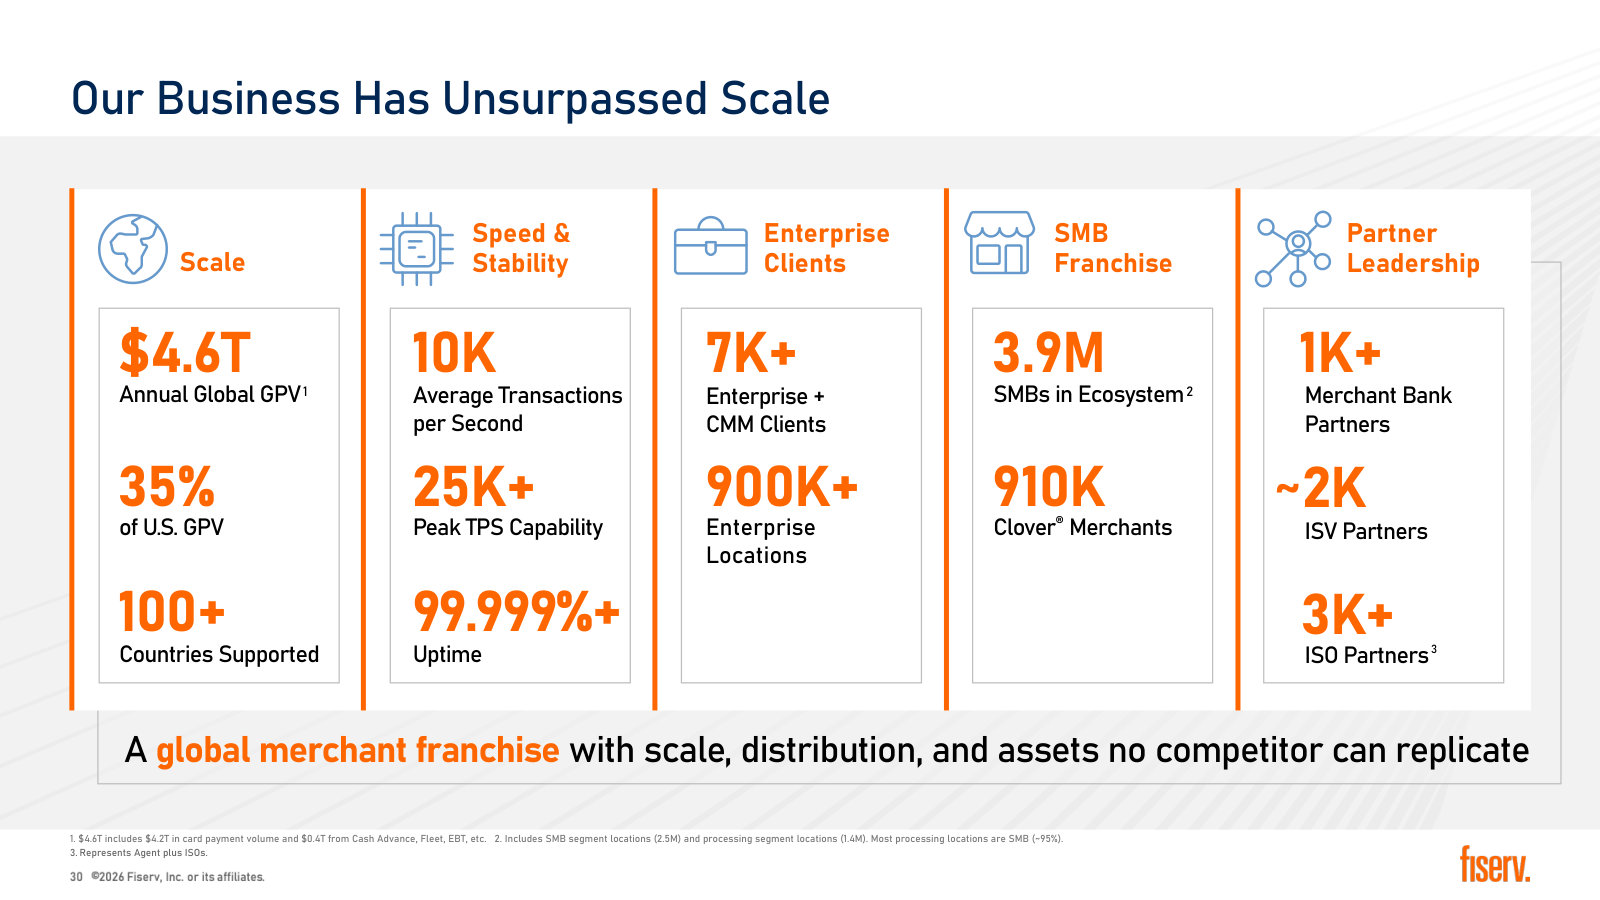
| Annual global merchant gross payment volume (US$ trillions) | — | — | — | — | 4.6 |
| Share of U.S. gross payment volume | — | — | — | — | 35% |
| Transactions processed annually (billions) | — | — | — | — | 300 |
| Issuer accounts on file (billions) | — | — | — | — | 1.8 |
| SMBs in ecosystem (millions) | — | — | — | — | 3.9 |
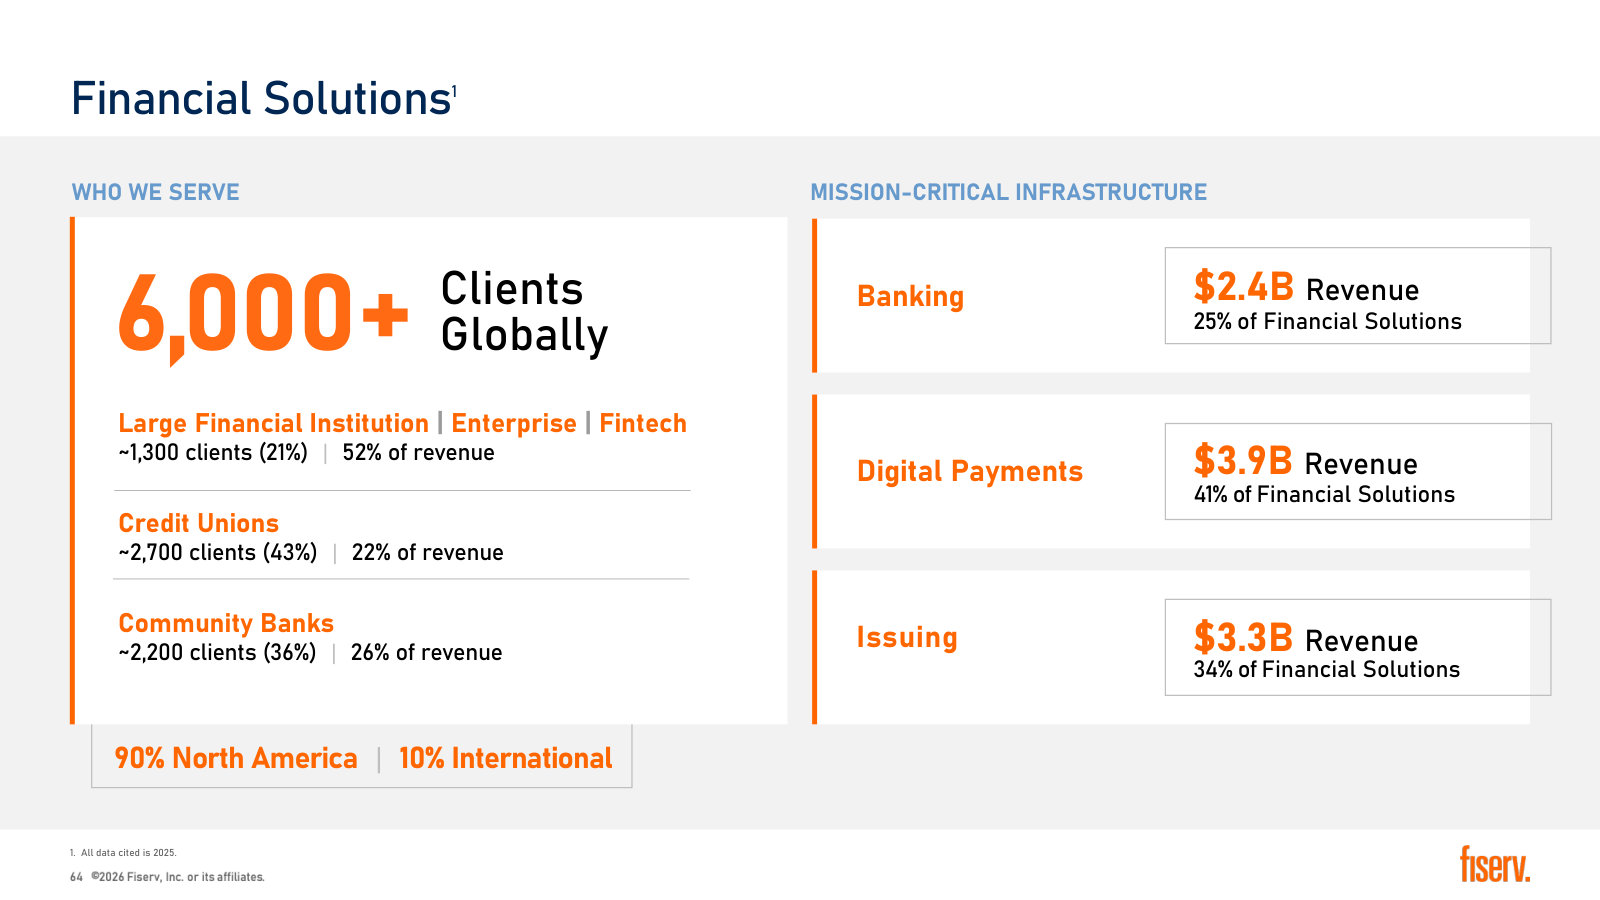
| Financial institution clients globally | — | — | — | — | 6,000 |
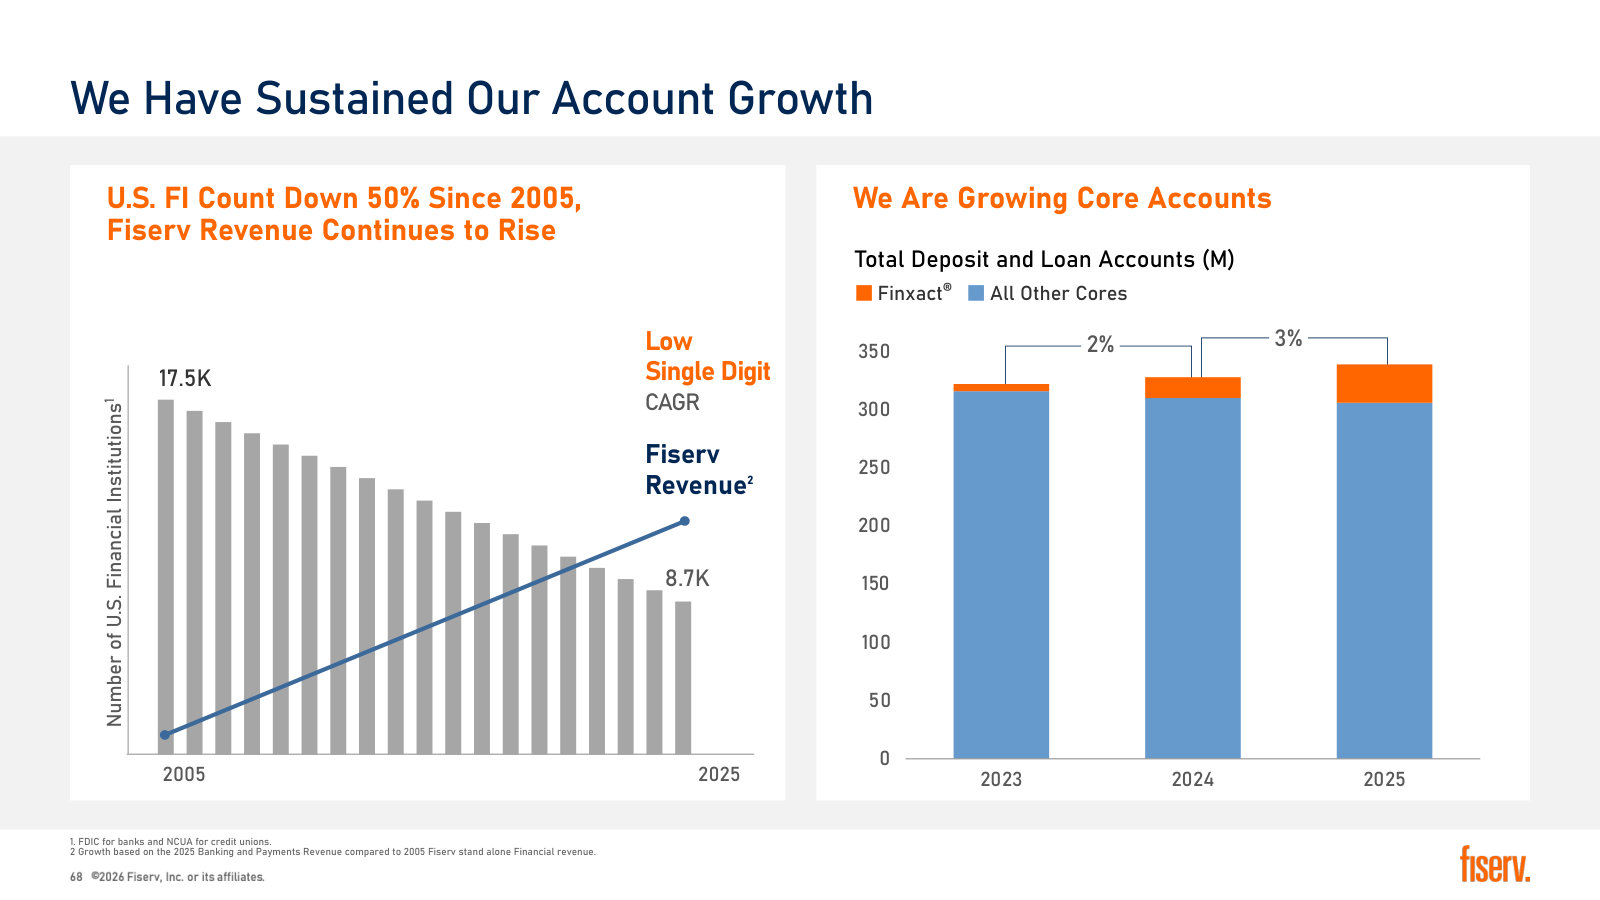
| Deposit and loan accounts globally (millions) | — | — | — | — | 339 |
Source: company filings [30]. Click any linked figure to open the filing page with the row highlighted.
Long-Term Record
| Fiscal year | Total revenue | Operating income | Net income attributable to Fiserv, Inc. | Net income attributable to Fiserv, Inc. per share - diluted | Net cash provided by operating activities | Capital expenditures, including capitalized software and other intangibles |
|---|---|---|---|---|---|---|
| FY2018 | 5,823 | 1,753 | 1,187 | 2.87 | 1,552 | (360) |
| FY2019 | 10,187 | 1,609 | 893 | 1.71 | 2,795 | (721) |
| FY2020 | 14,852 | 1,852 | 958 | 1.40 | 4,147 | (900) |
| FY2021 | 16,226 | 2,288 | 1,334 | 1.99 | 4,034 | (1,160) |
| FY2022 | 17,737 | 3,740 | 2,530 | 3.91 | 4,618 | (1,479) |
| FY2023 | 19,093 | 5,014 | 3,068 | 4.98 | 5,162 | (1,388) |
| FY2024 | 20,456 | 5,879 | 3,131 | 5.38 | 6,631 | (1,569) |
| FY2025 | 21,193 | 5,818 | 3,480 | 6.34 | 6,062 | (1,763) |
Source: consolidated statements across filings; older years from the standardized feed [13] [1] [14] [2]. Click any linked figure to open the filing page with the row highlighted.
Analyst Consensus
Mean target
Median target
High target
Low target
Street ratings: 6 strong buy, 3 buy, 25 hold, 1 sell, 1 strong sell. Consensus: Hold.
Estimate source: S&P Capital IQ (CapIQ) consensus, as of 2026-07-31. Estimate figures are S&P Capital IQ consensus (vendor data — no filing page links). EPS and net income use the normalized (adjusted) consensus where the street reports it. Line-item analyst models (segments, drivers, KPIs) are in the Visible Alpha tab.
Traceability
490 of 497 figures on this page (99%) link to the filing page where they are printed — click a linked figure to open the source PDF at that page with the row highlighted. Unlinked figures come from standardized data feeds or pre-filing years.
Display units are US$ millions, as printed on every Fiserv consolidated statement ('In millions, except per share data'). Per-share and share-count rows are exempt from that scale.
Each fiscal year's income statement, balance sheet and cash-flow figures are cited to that year's own Form 10-K (FY2021-FY2025), so every column is a first-reported figure rather than a later comparative.
Revenue by Business Line and reportable segment operating income are cited to the FY2025 Form 10-K (FY2025) and the FY2024 Form 10-K (FY2024, FY2023, FY2022). FY2021 is blank in both tables: Fiserv reorganised from three segments (Merchant Acceptance, Payments and Network, Financial Technology) into two (Merchant Solutions, Financial Solutions) in 2024, and no filing in the corpus restates FY2021 onto the current basis.
The FY2024 Form 10-K labels the segment subtotals 'Total Merchant segment revenue' and 'Total Financial segment revenue'; the FY2025 Form 10-K adds 'Solutions'. Row labels use the FY2025 wording; each quote is verbatim from the page cited.
Cash-flow row labels follow the FY2022-FY2025 filings. The FY2021 Form 10-K prints the same subtotals with the suffix 'from continuing operations' (operating, investing and financing), and its acquisitions line reads 'Payments for acquisitions of businesses, net of cash acquired and including working capital adjustments'; the quotes reproduce those printed labels.
'Payments for acquisition of businesses, net of cash acquired' is printed as an em dash (nil) for FY2024, so that cell carries a value of 0 with no citation - an em dash gives the renderer no figure to anchor a highlight on.
FY2018 figures in the Long-Term Record come from the standardized data feed (SEC XBRL) and are shown without page links. FY2019 and FY2020 are cited to the comparative columns of the FY2021 Form 10-K.
FY2019 includes First Data from the July 29, 2019 acquisition date, which is why revenue, operating income and share counts step up sharply between FY2018 and FY2020.
Balance-sheet totals swing with settlement assets and obligations, which are equal-and-offsetting intermediary balances (US$27.7bn at FY2023 versus US$15.4bn at FY2024). Total assets are not comparable year to year without that line.
Quarterly columns cover Q1-Q3 only. Fiserv files no fourth-quarter report, no filing in the corpus prints a stand-alone fourth-quarter statement, and the standardized quarterly feed carries no Q4 periods either.
Quarterly cash-flow figures for Q2 and Q3 are derived from consecutive printed year-to-date statements; every derived value was reconciled against data/financials/cash_flow_quarterly.json and agrees exactly.
Every FY2021-FY2025 income-statement, balance-sheet and cash-flow figure was cross-checked against data/financials/*.json (SEC XBRL feed). No conflict exceeded 0.5% and no sign flips were found, so discrepancies is empty. Note that the feed's 'net_income' field maps to the filing's 'Net income attributable to Fiserv, Inc.' line, not to the 'Net income' line that includes noncontrolling interests.
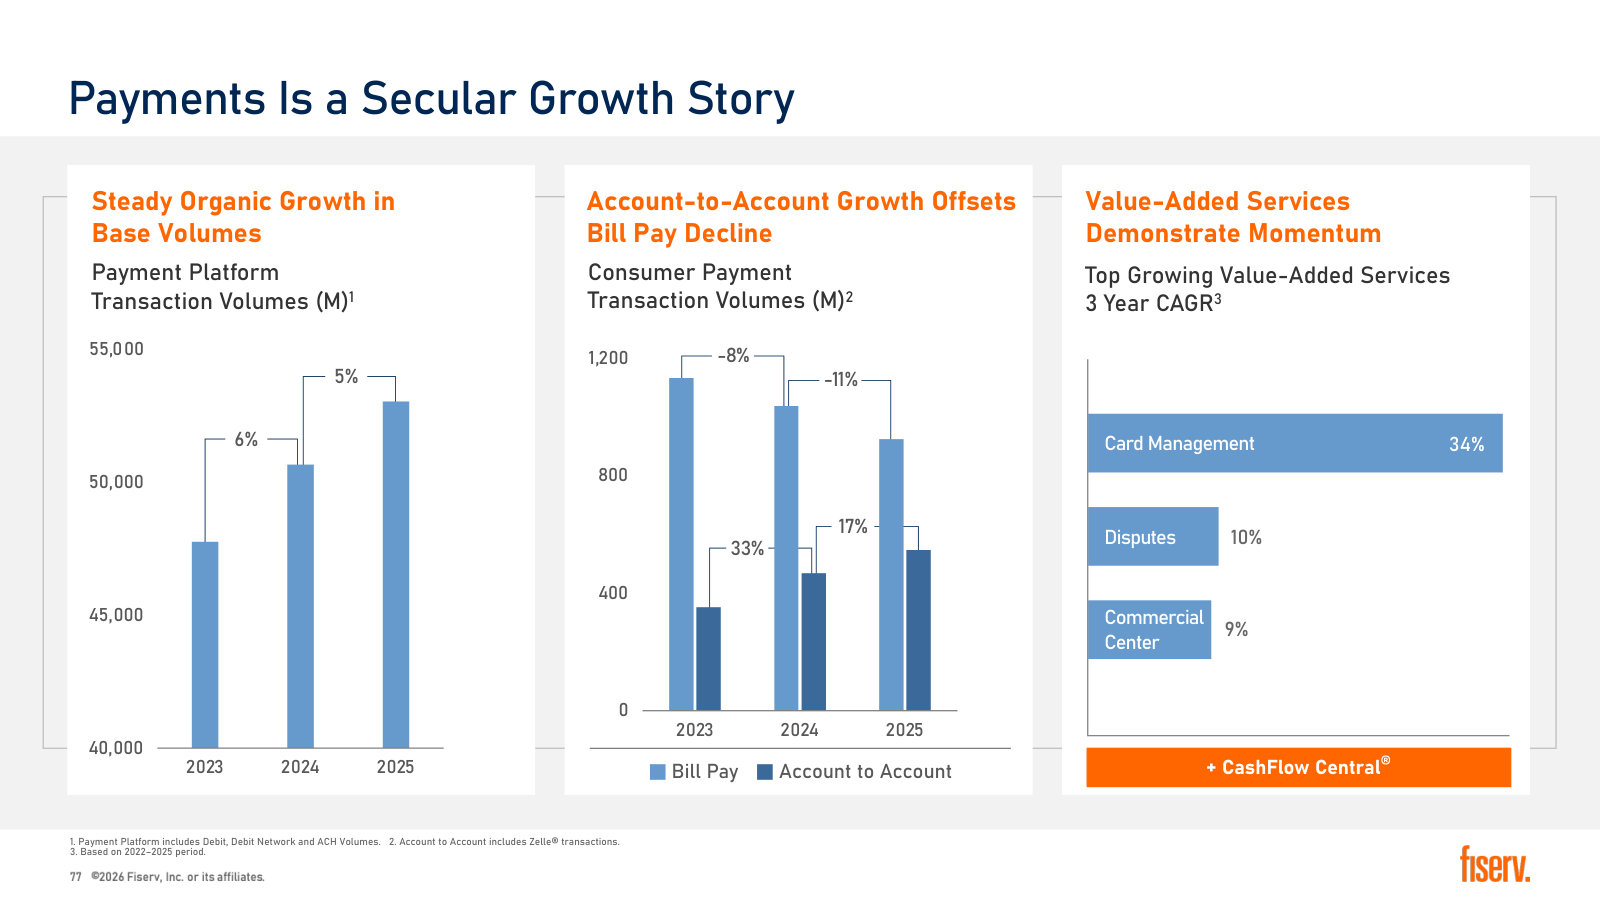
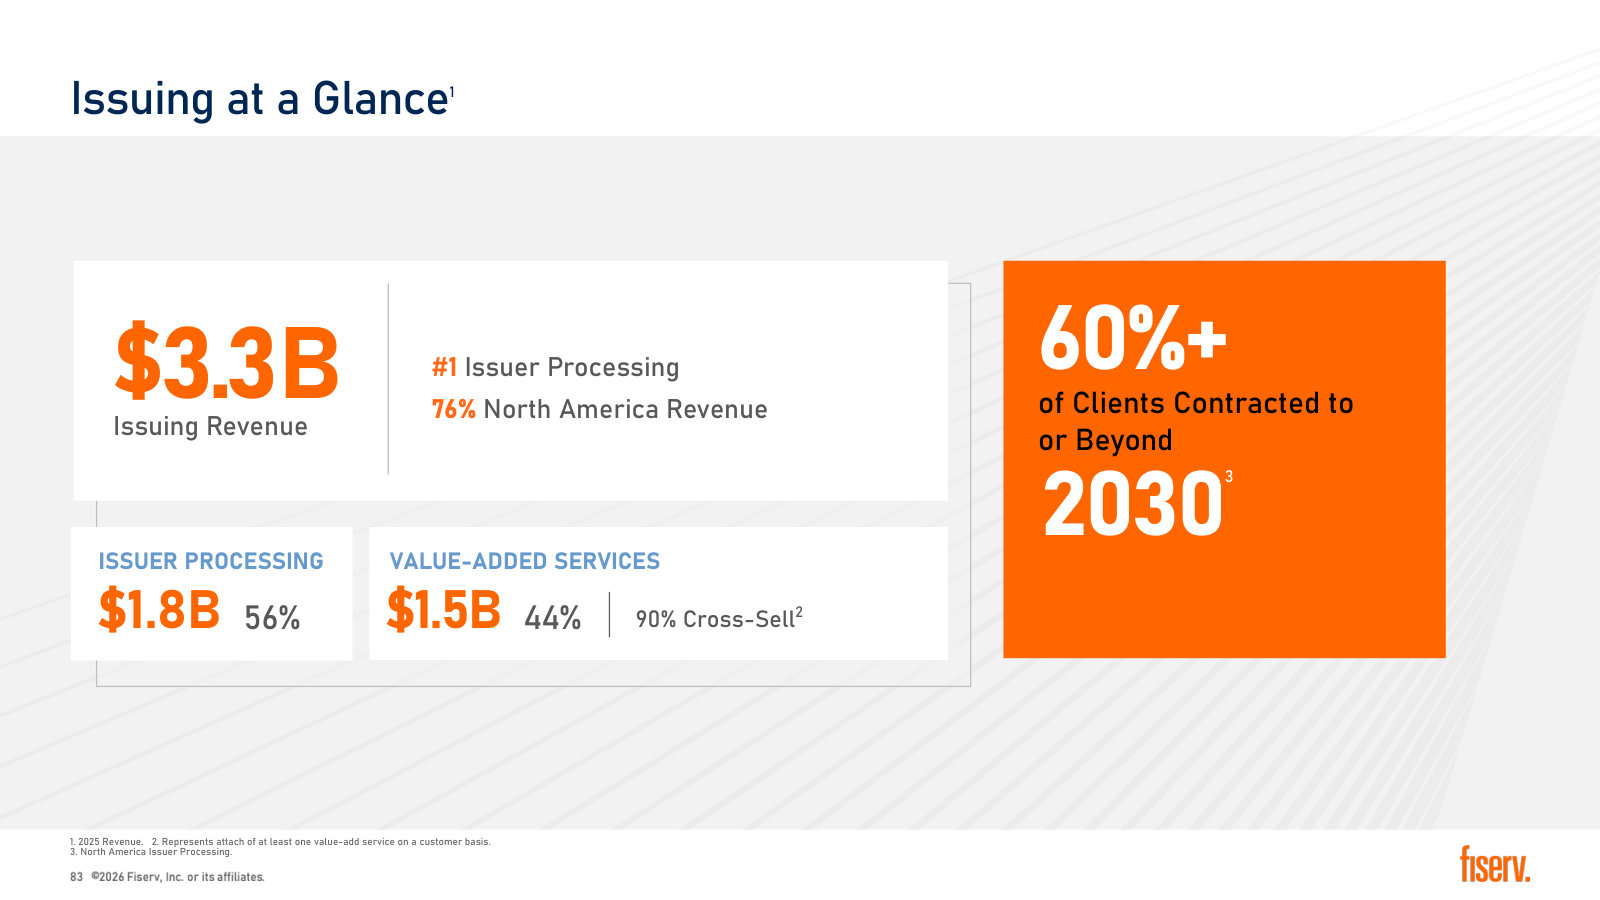
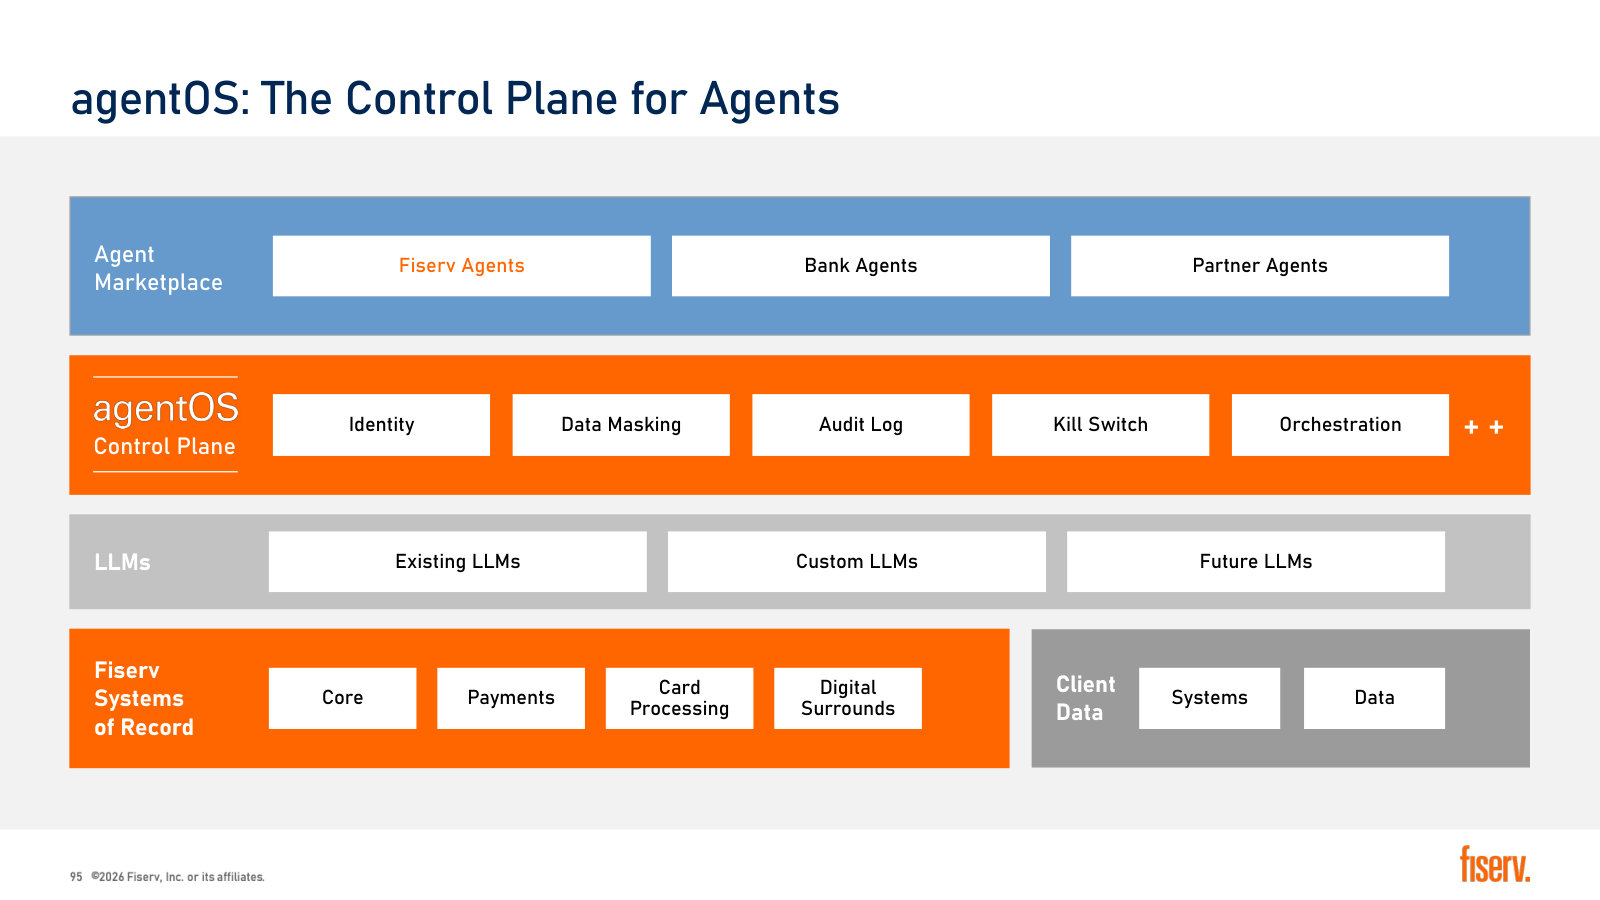
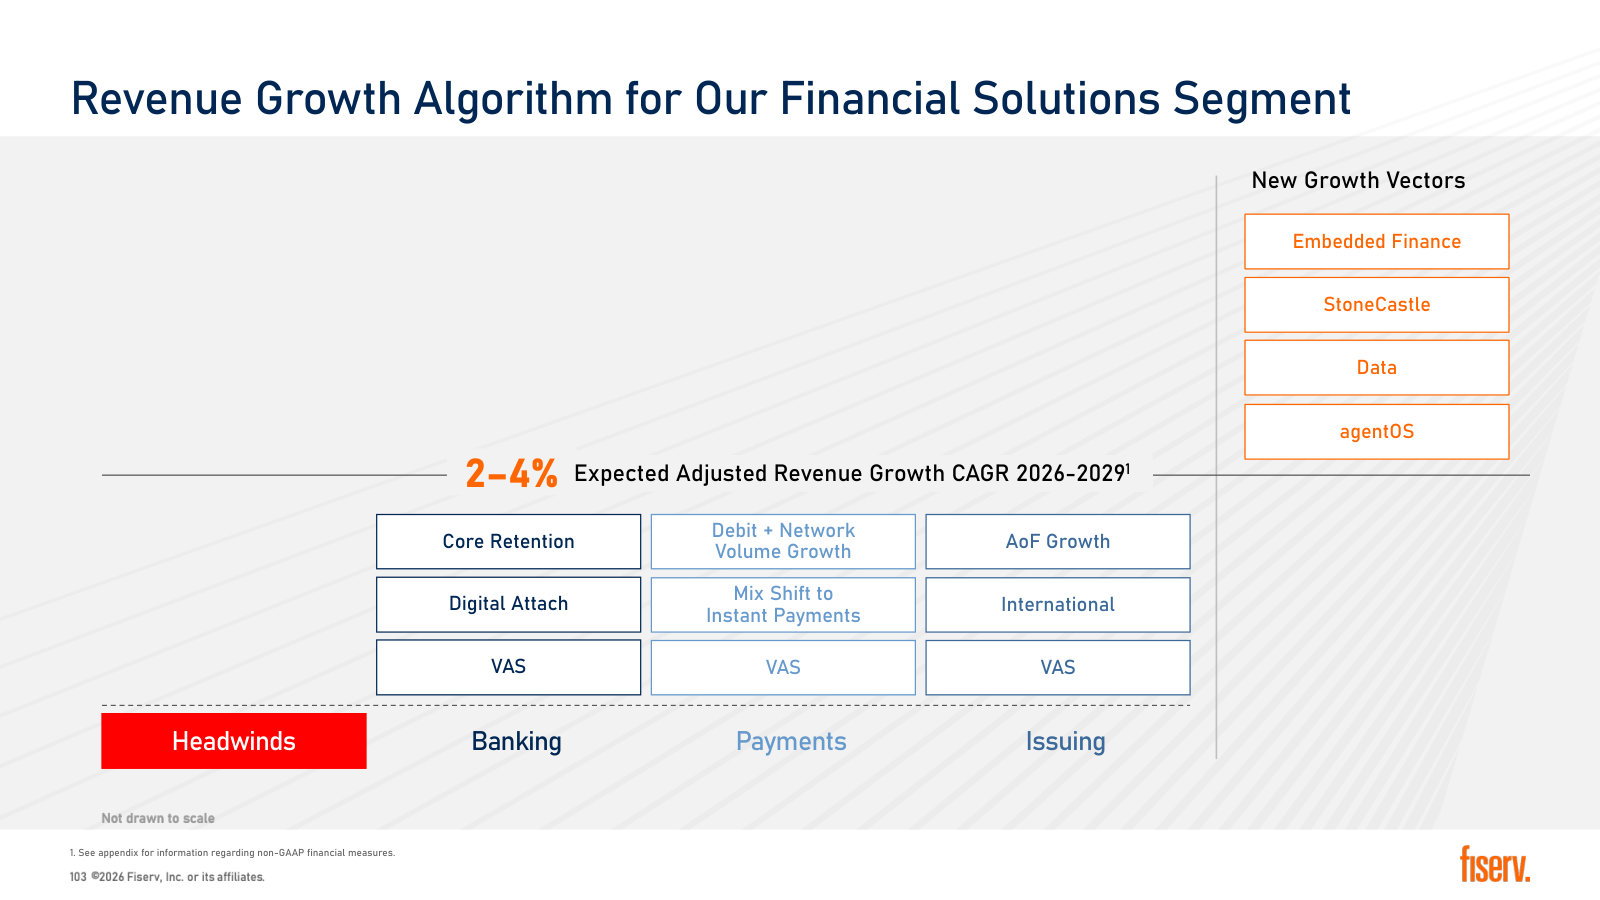
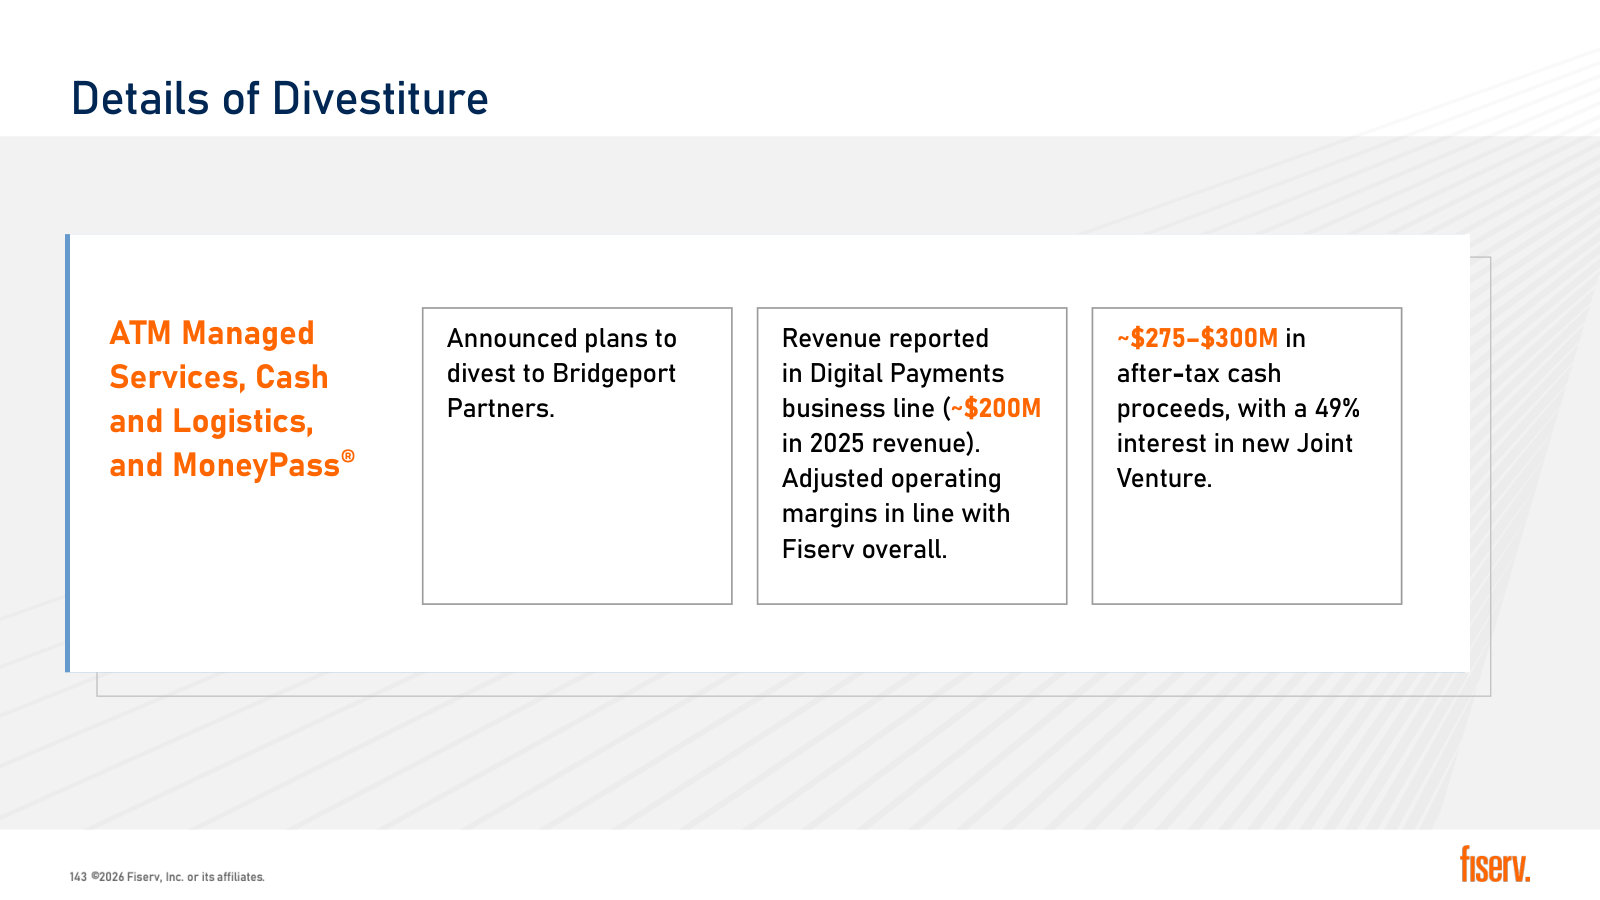
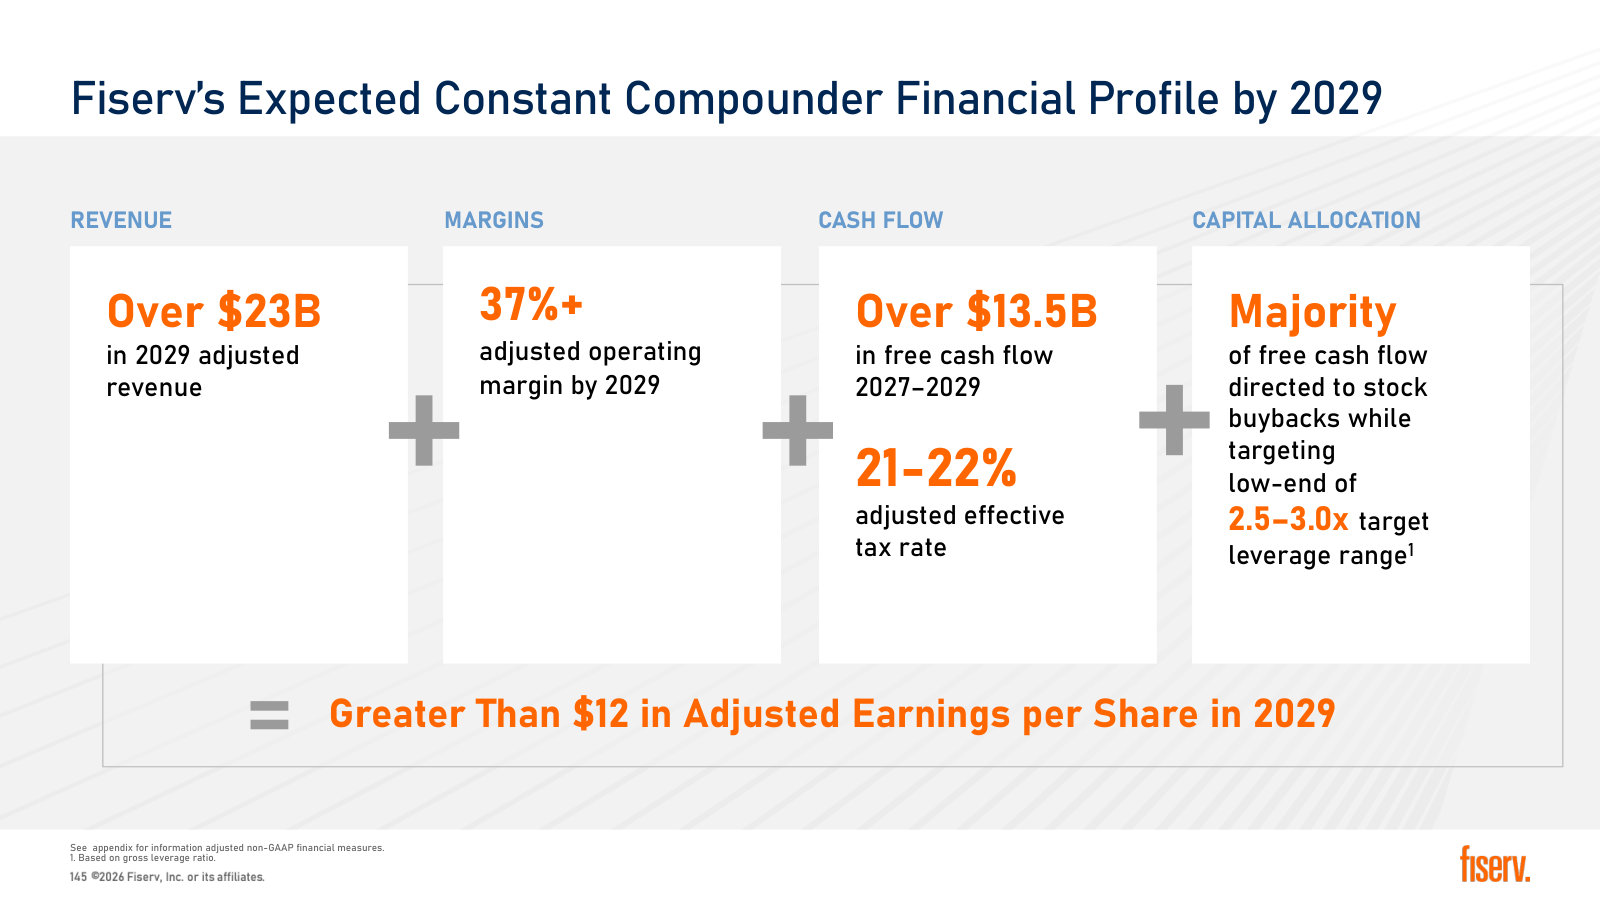
Fiserv, Inc.'s management explains the business in its own materials. The slides below do the most of that work, pulled from the documents preserved in Sources. Each source link opens the complete presentation at that slide in a new tab.
Investor Day 2026 — 2026
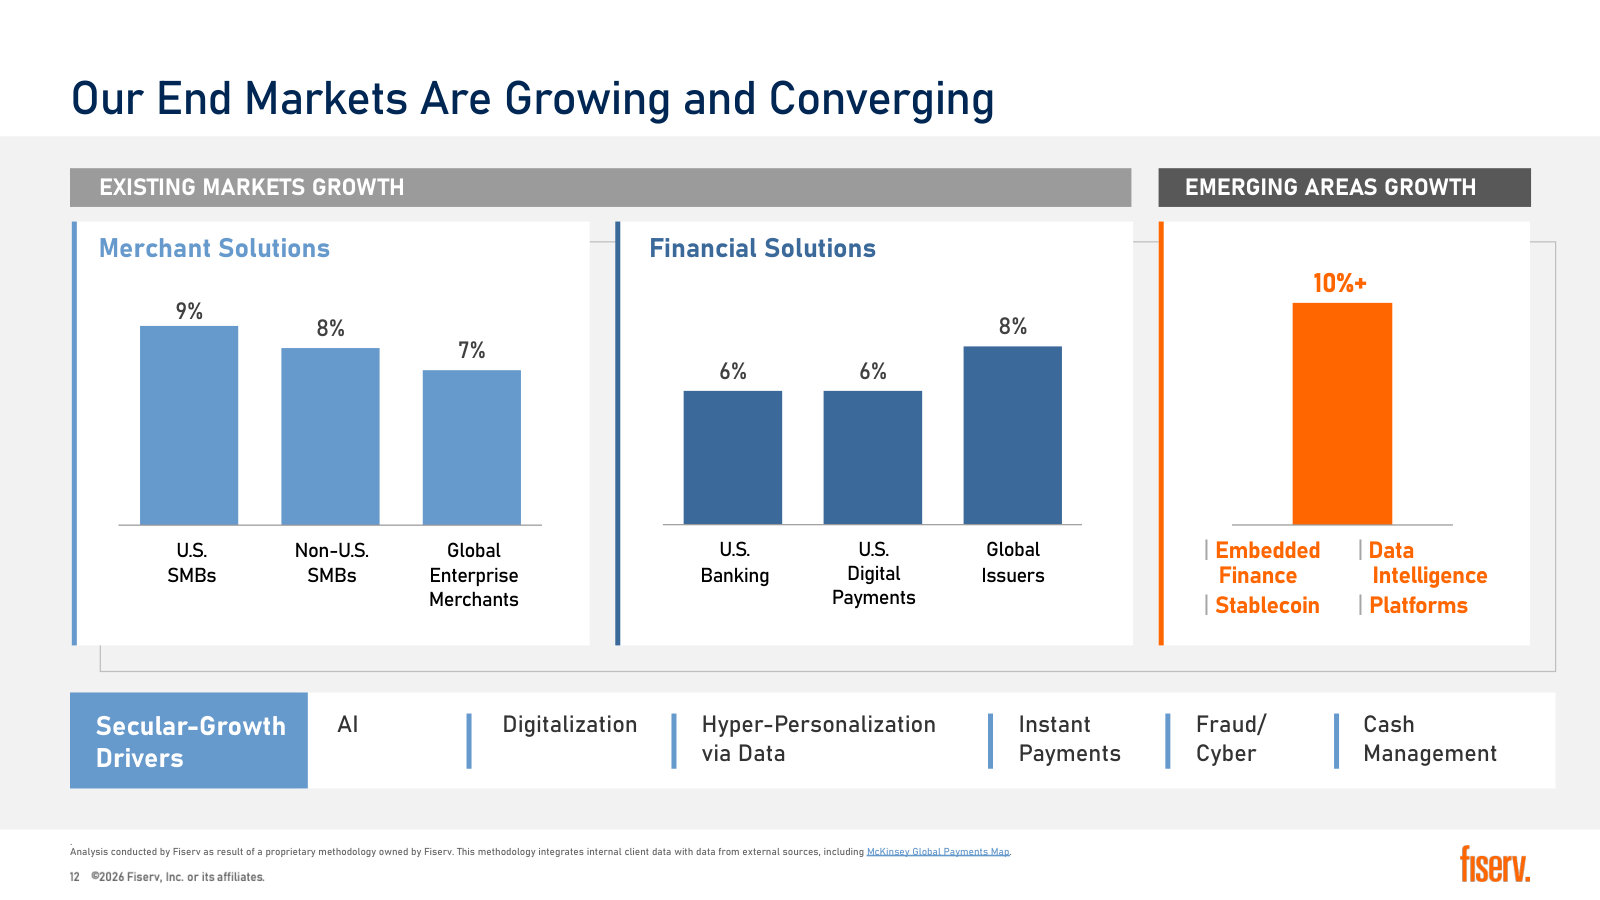
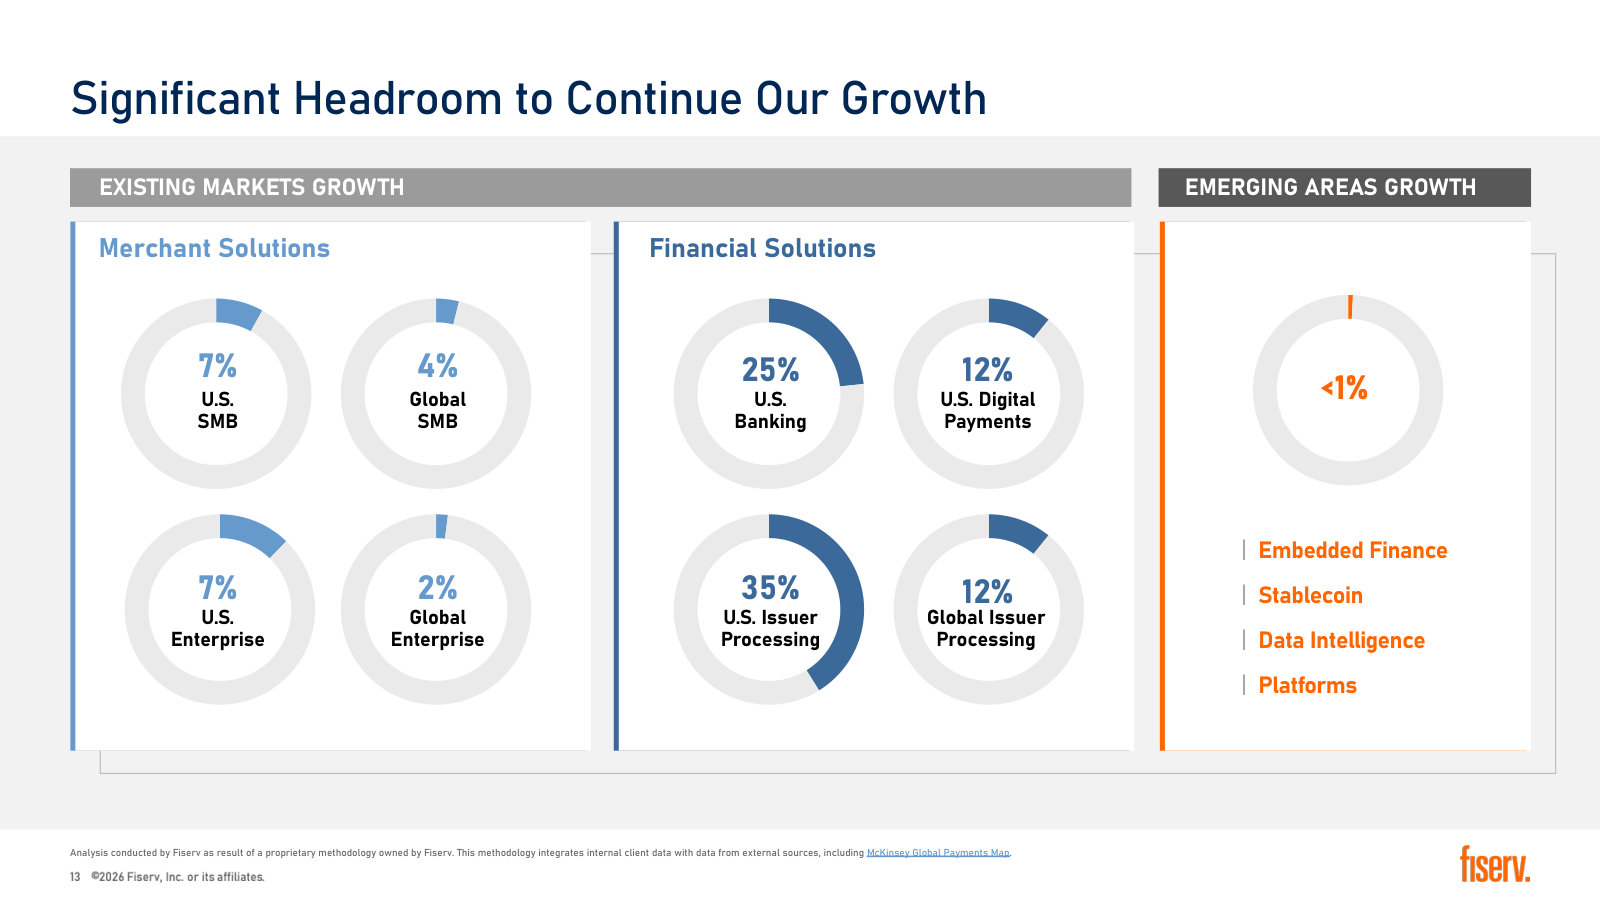
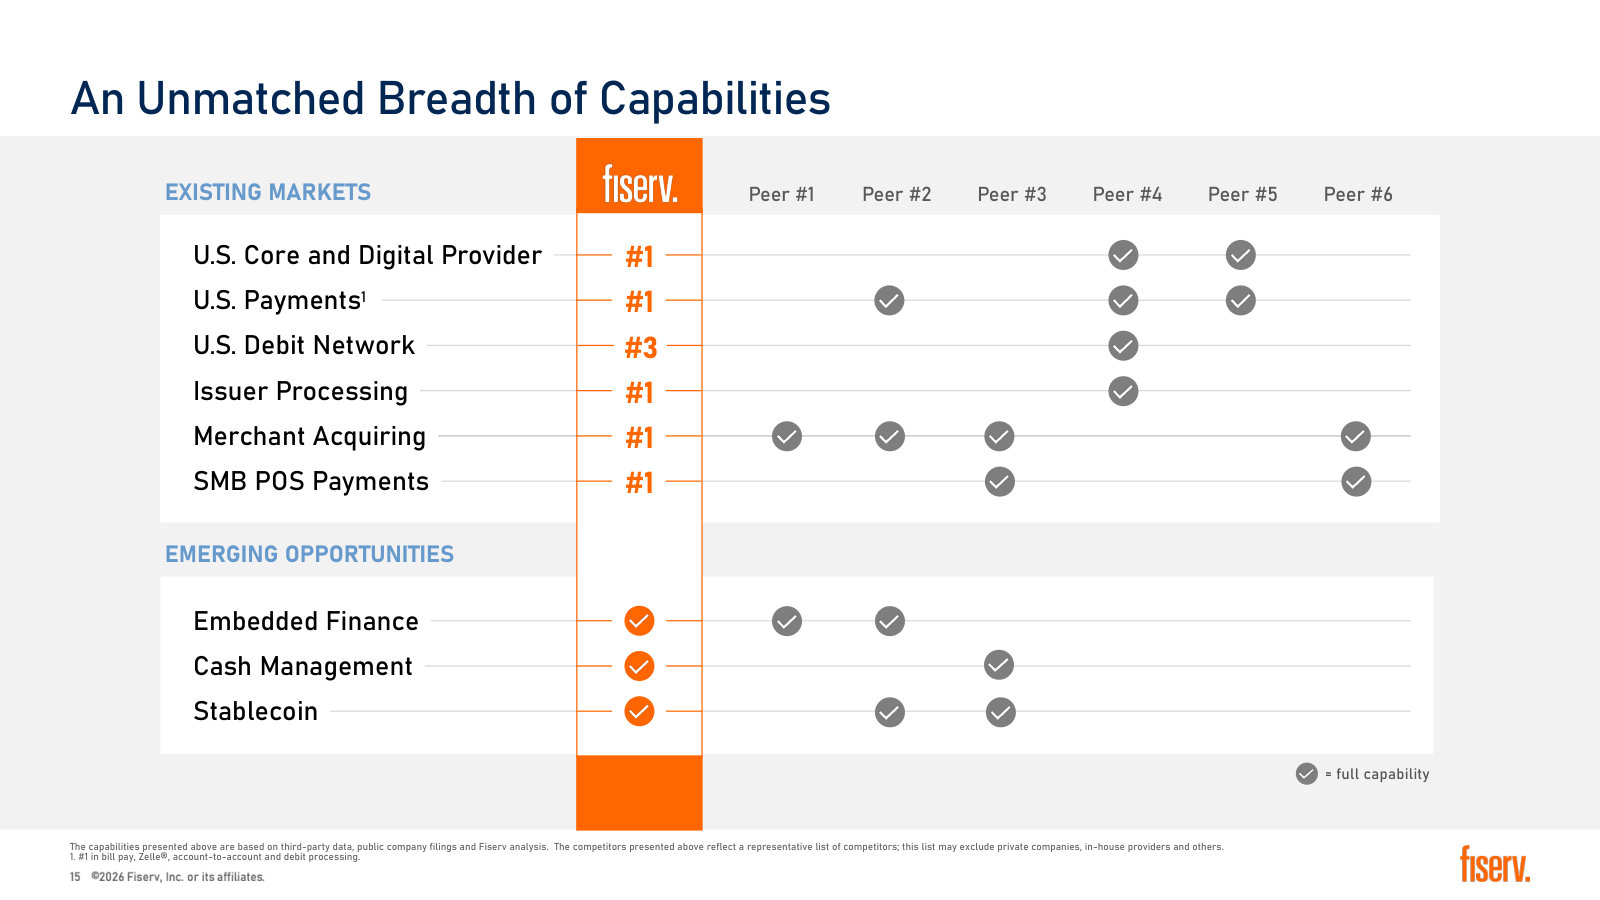
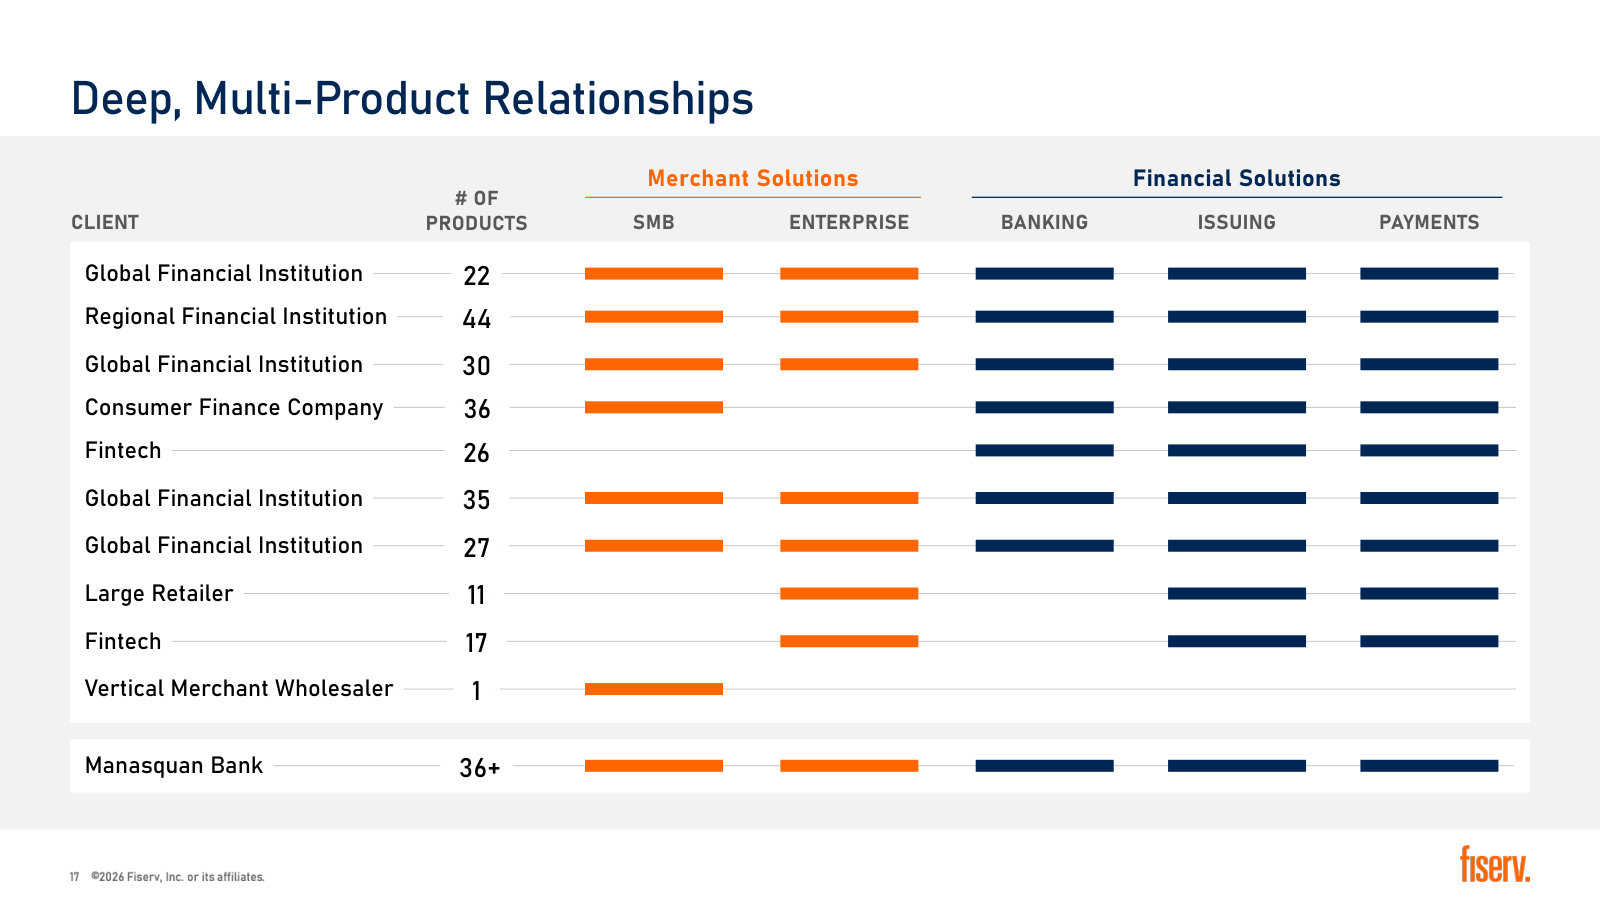
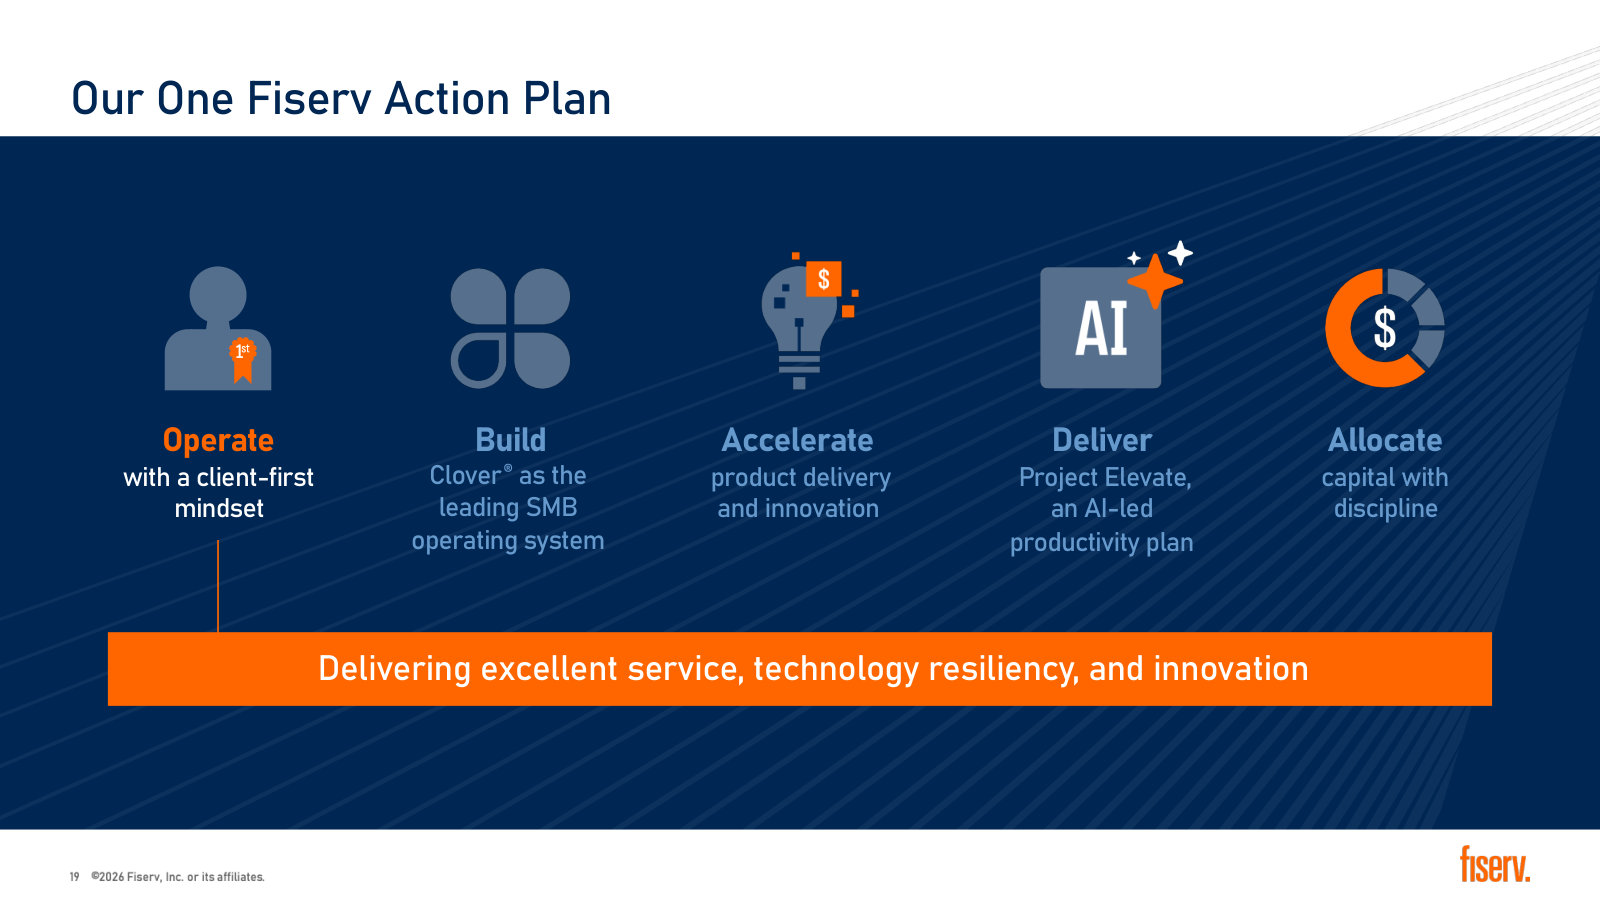
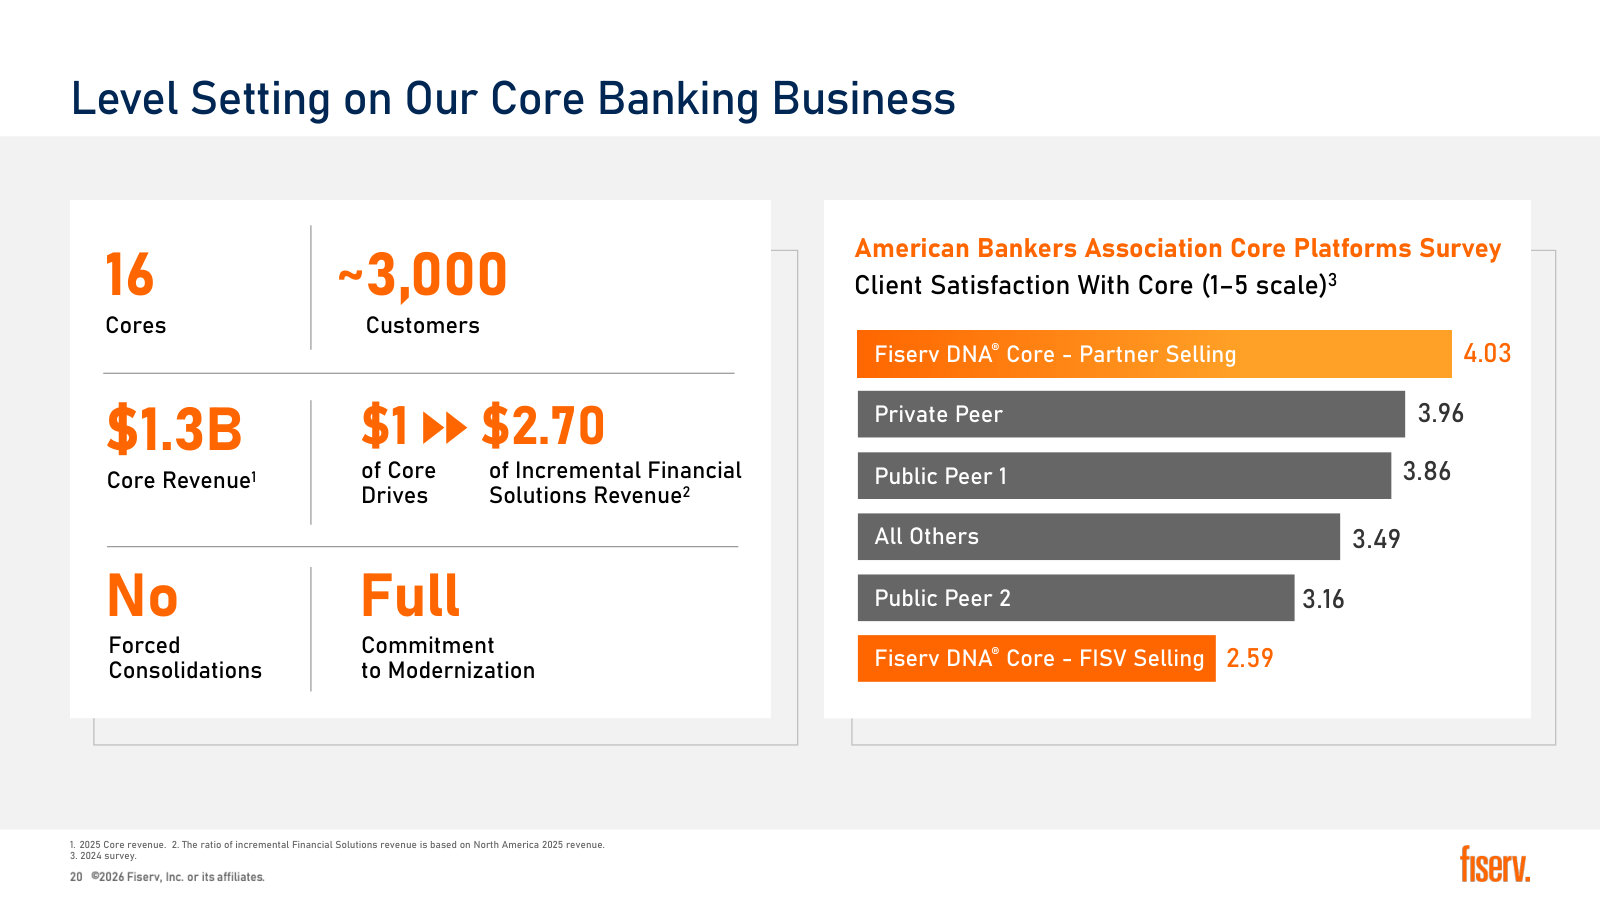
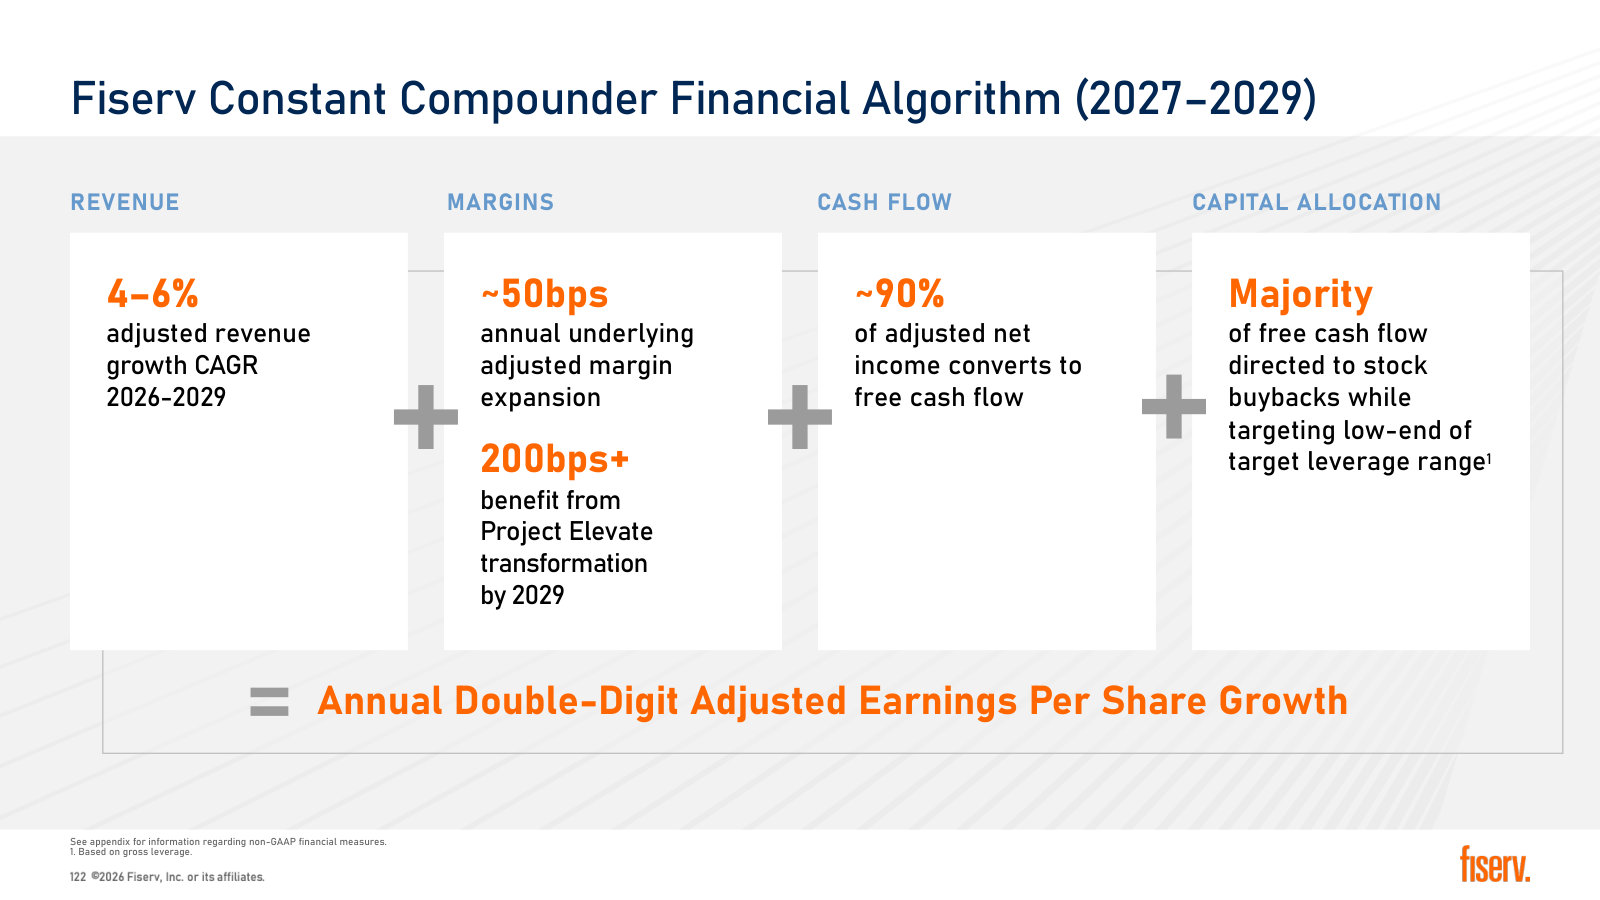
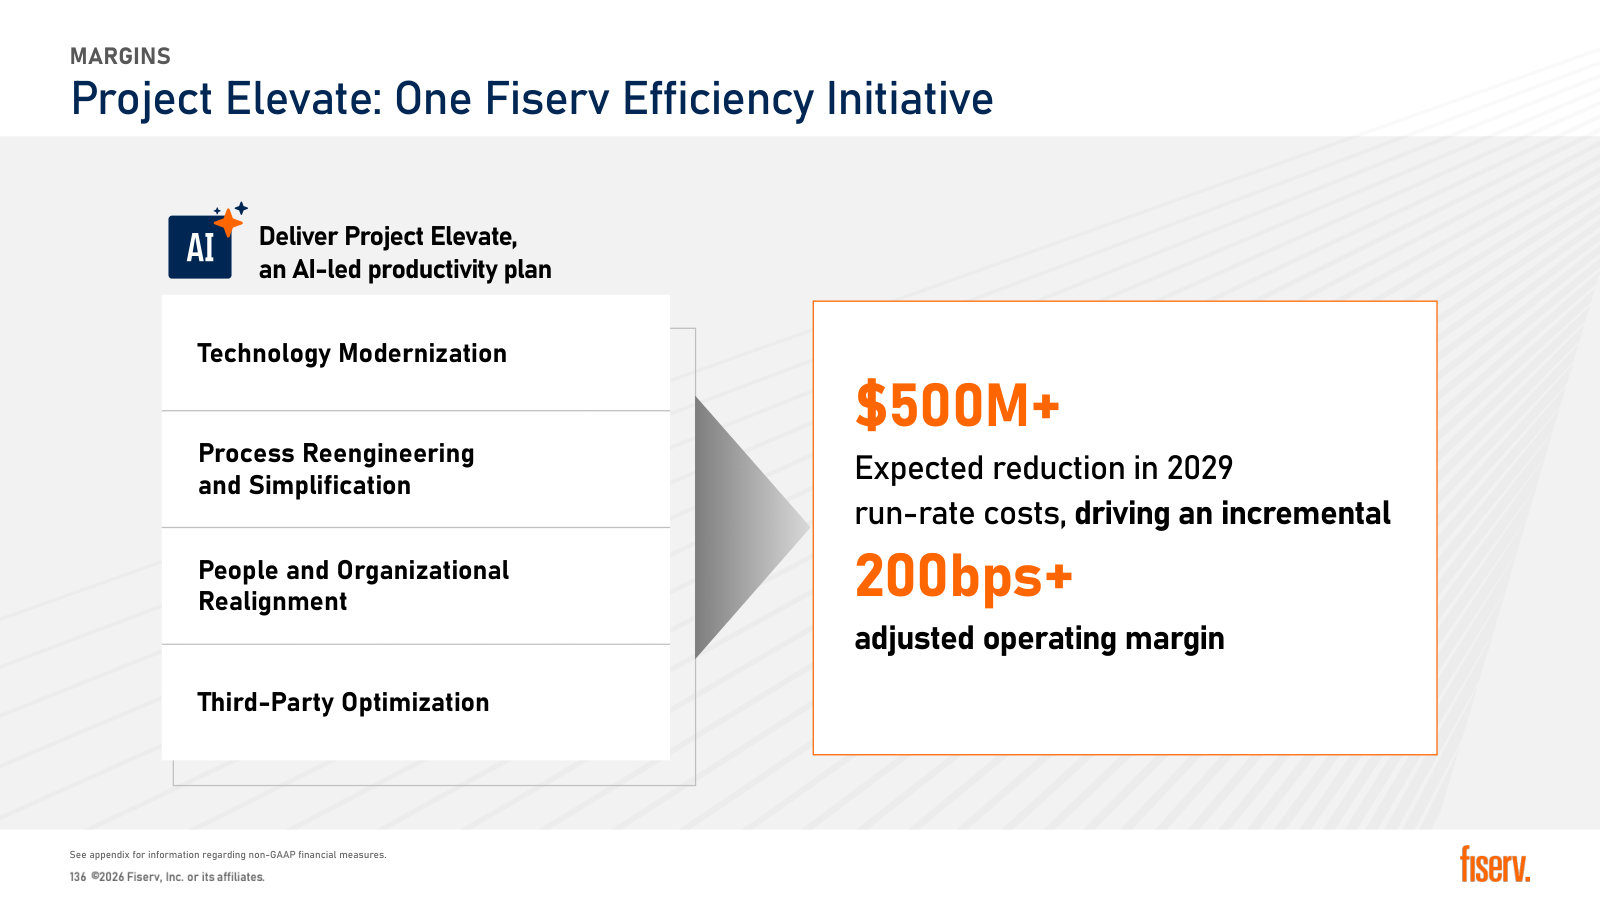
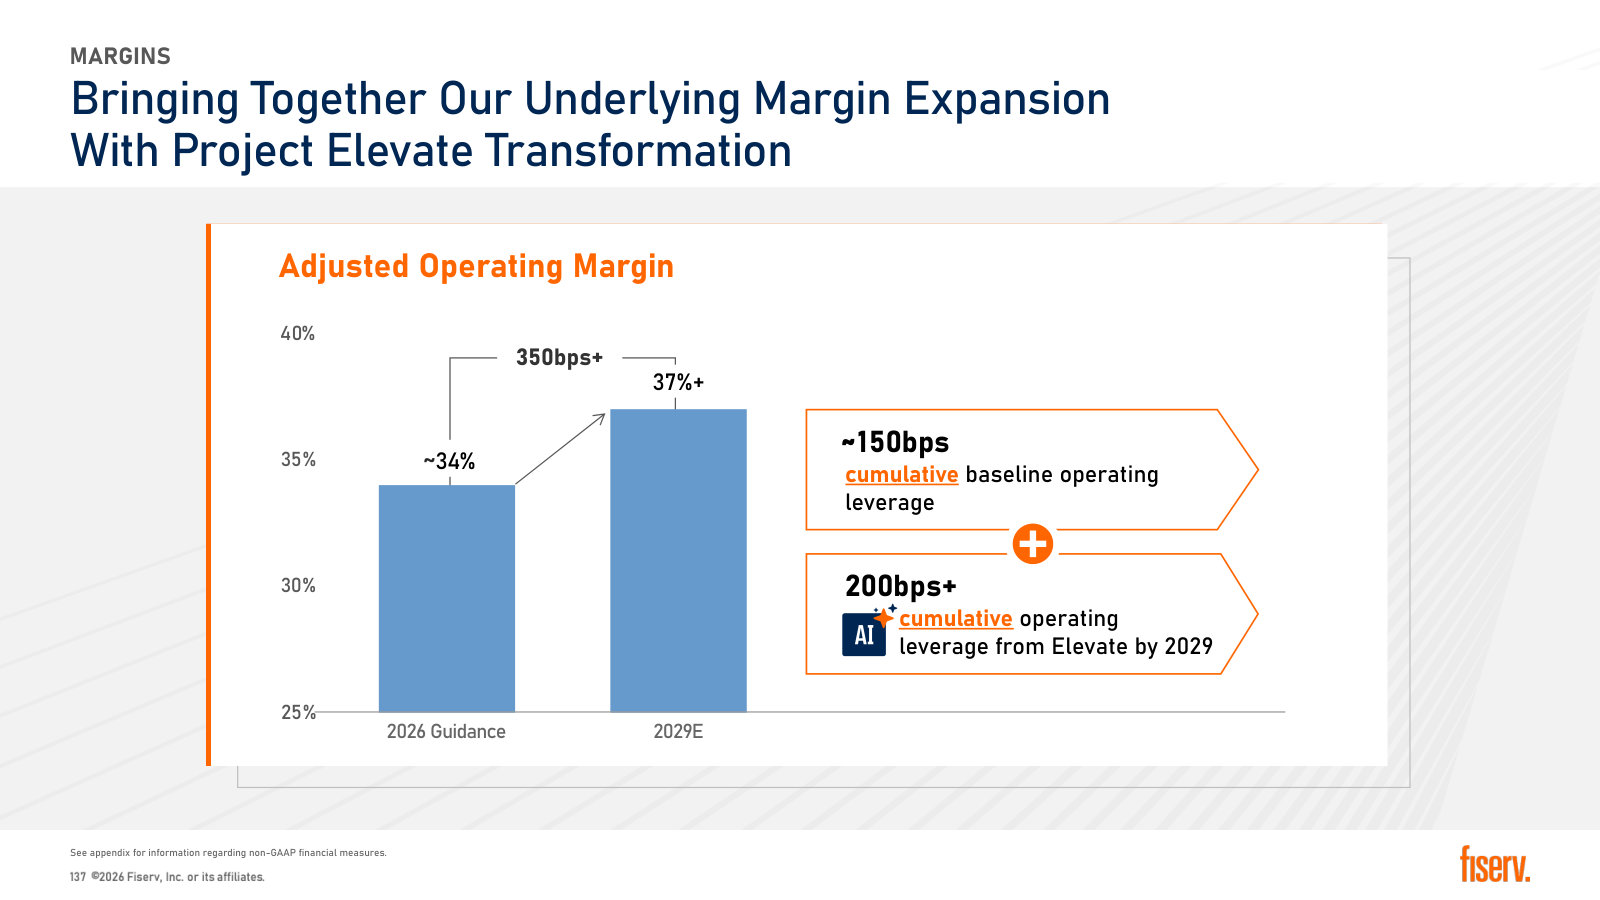
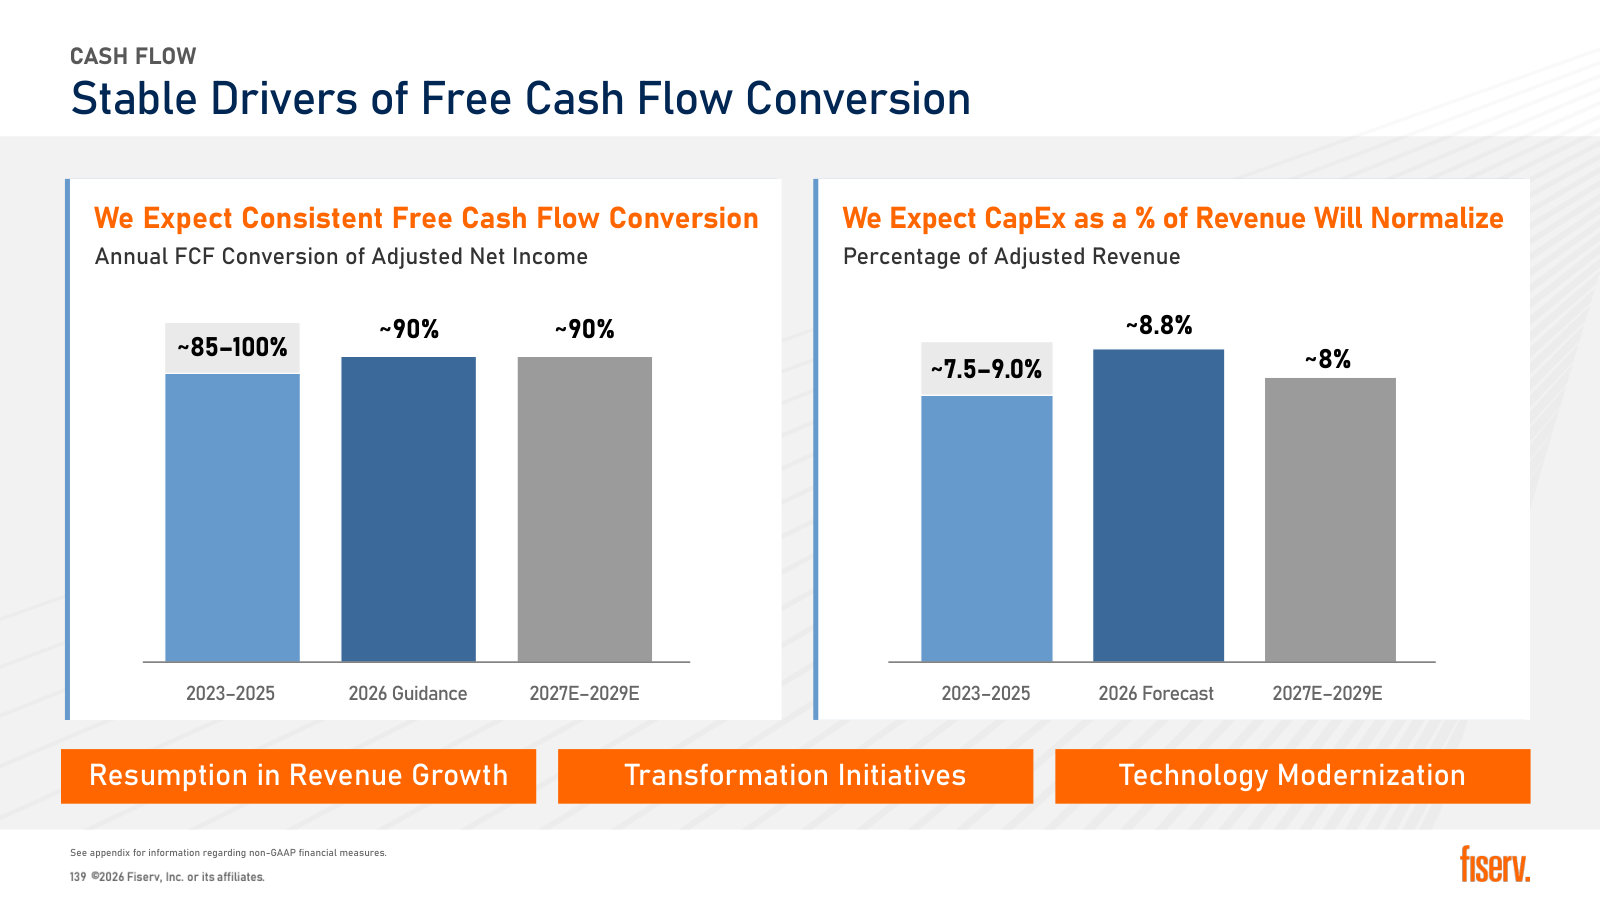
The strategic reset under CEO Mike Lyons: what each business is, where share and headroom sit, and the 2027-2029 targets management now owns. · Open the full document →
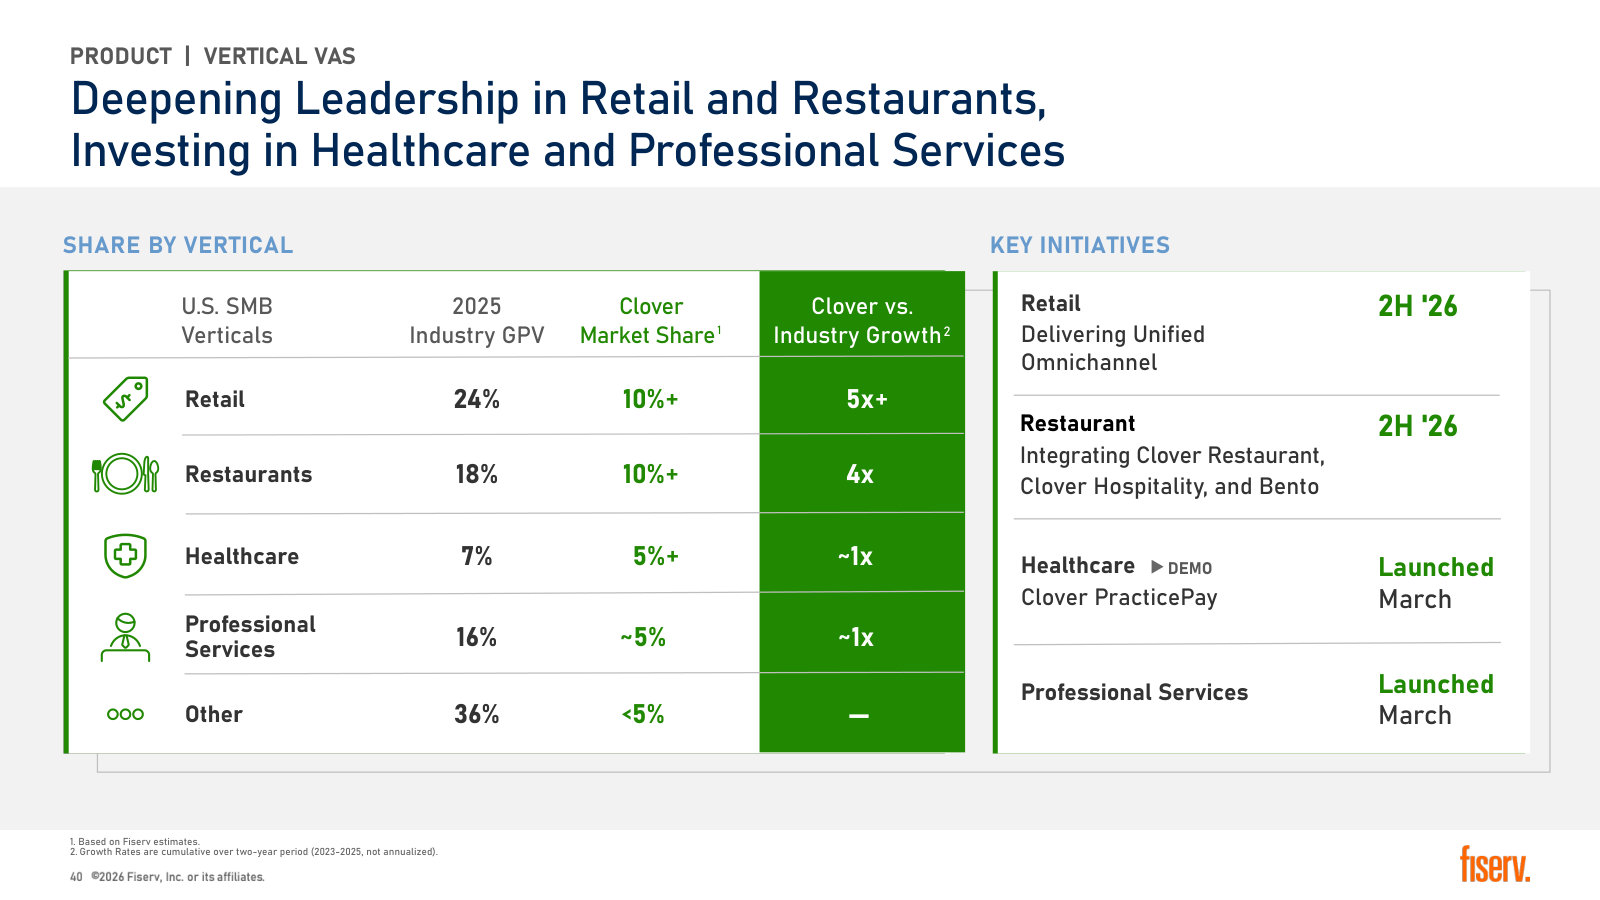
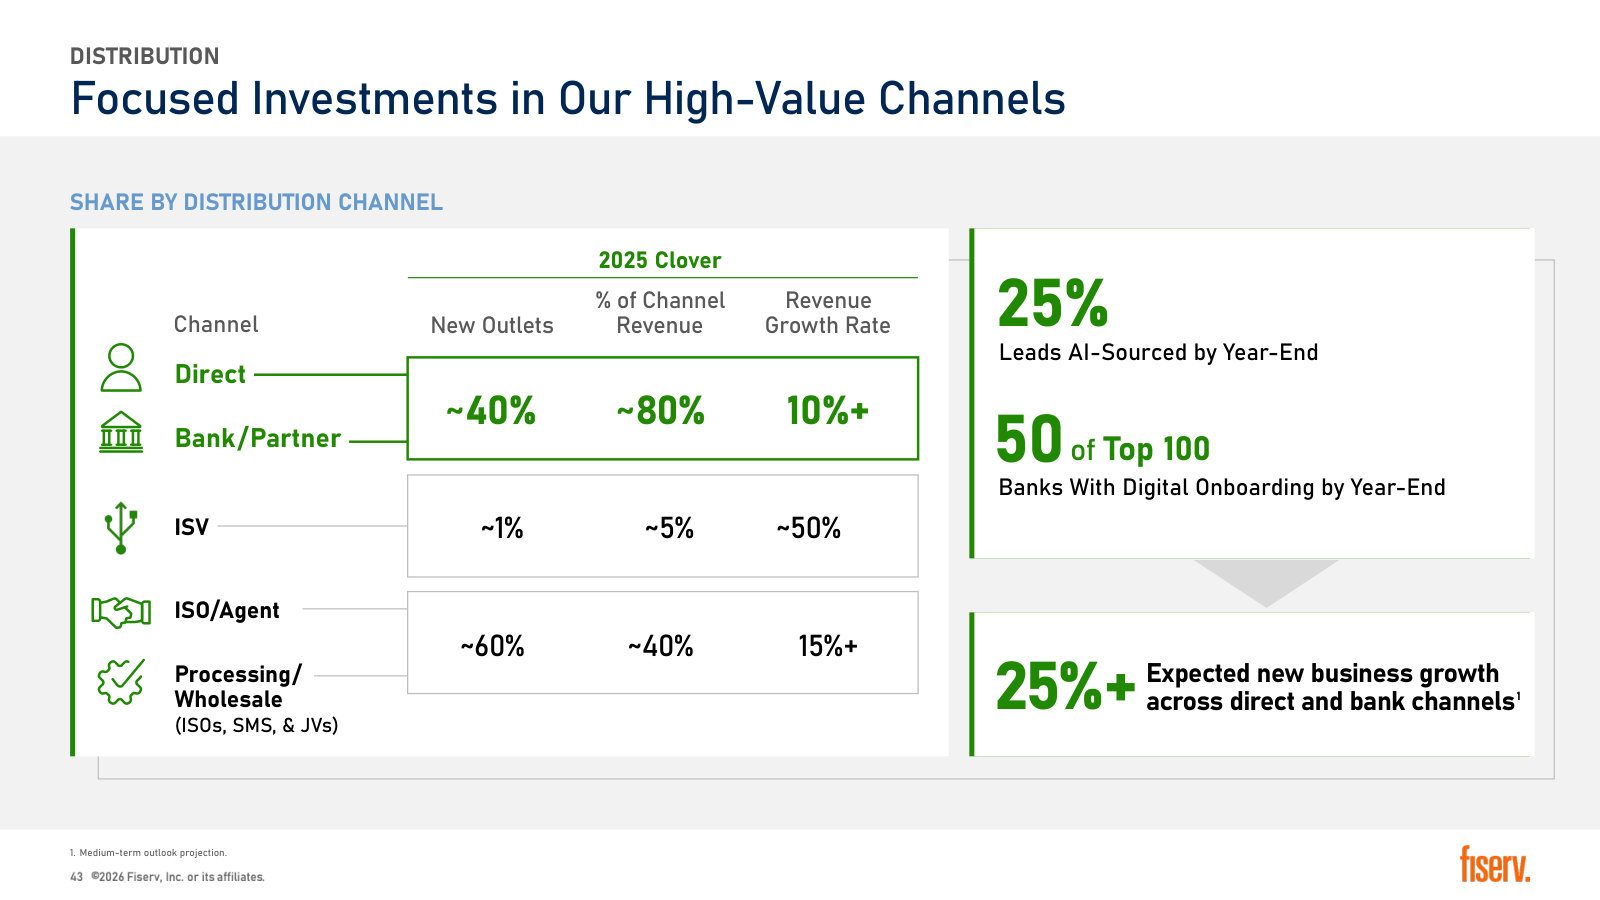
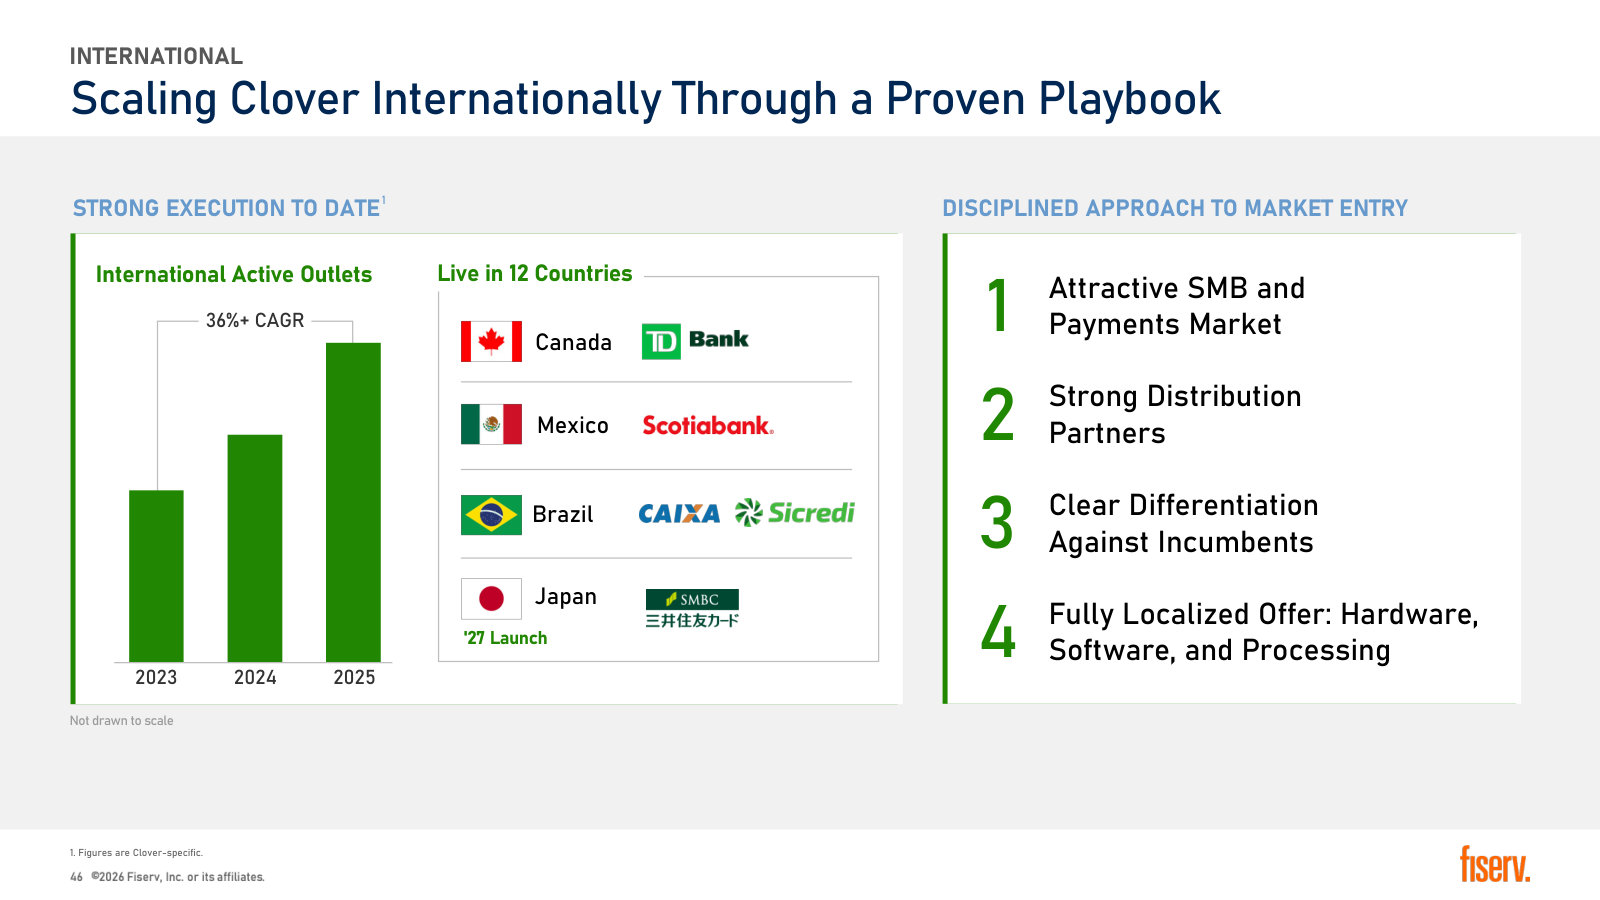
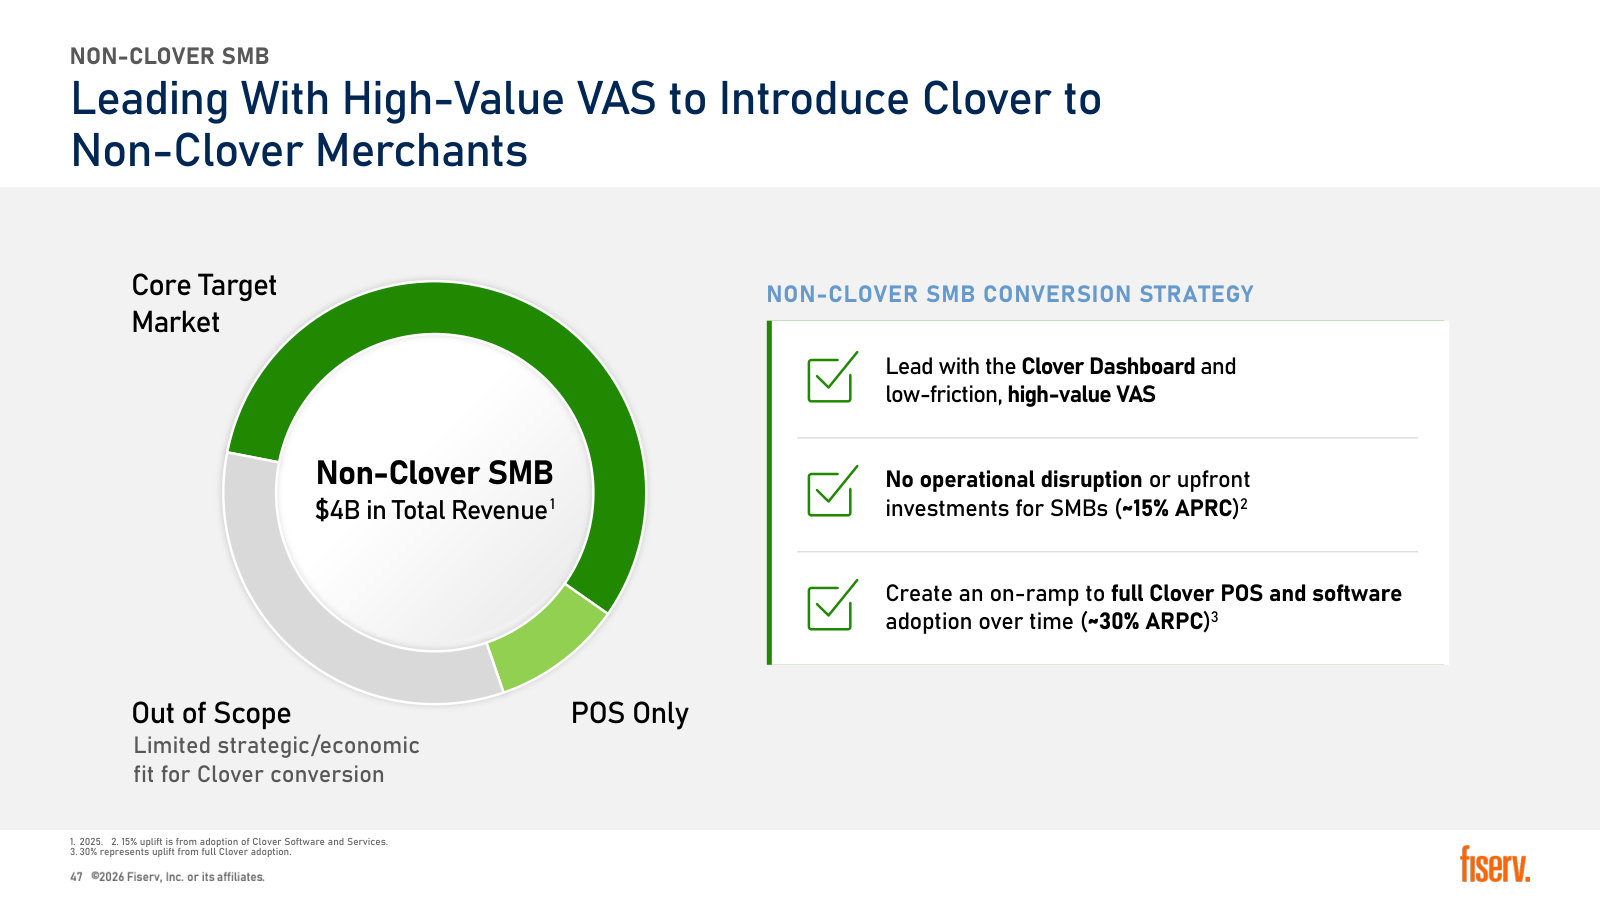
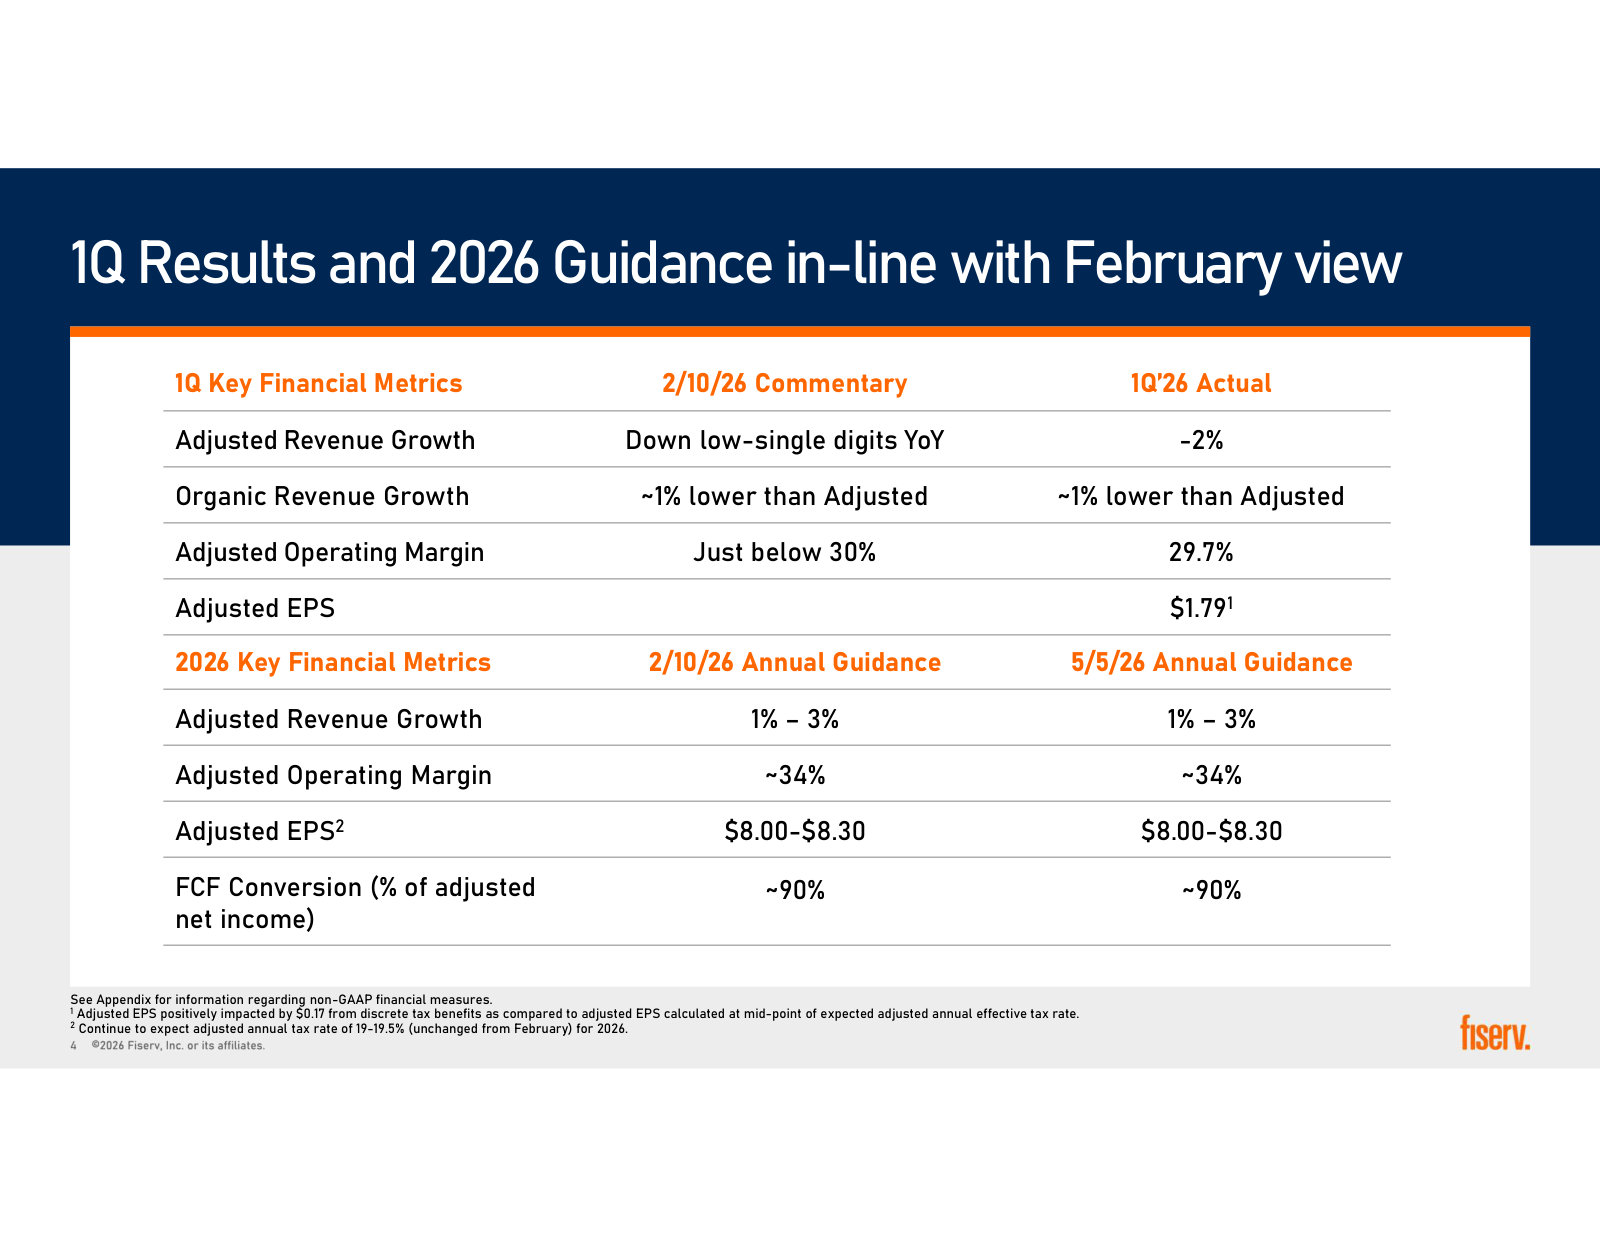
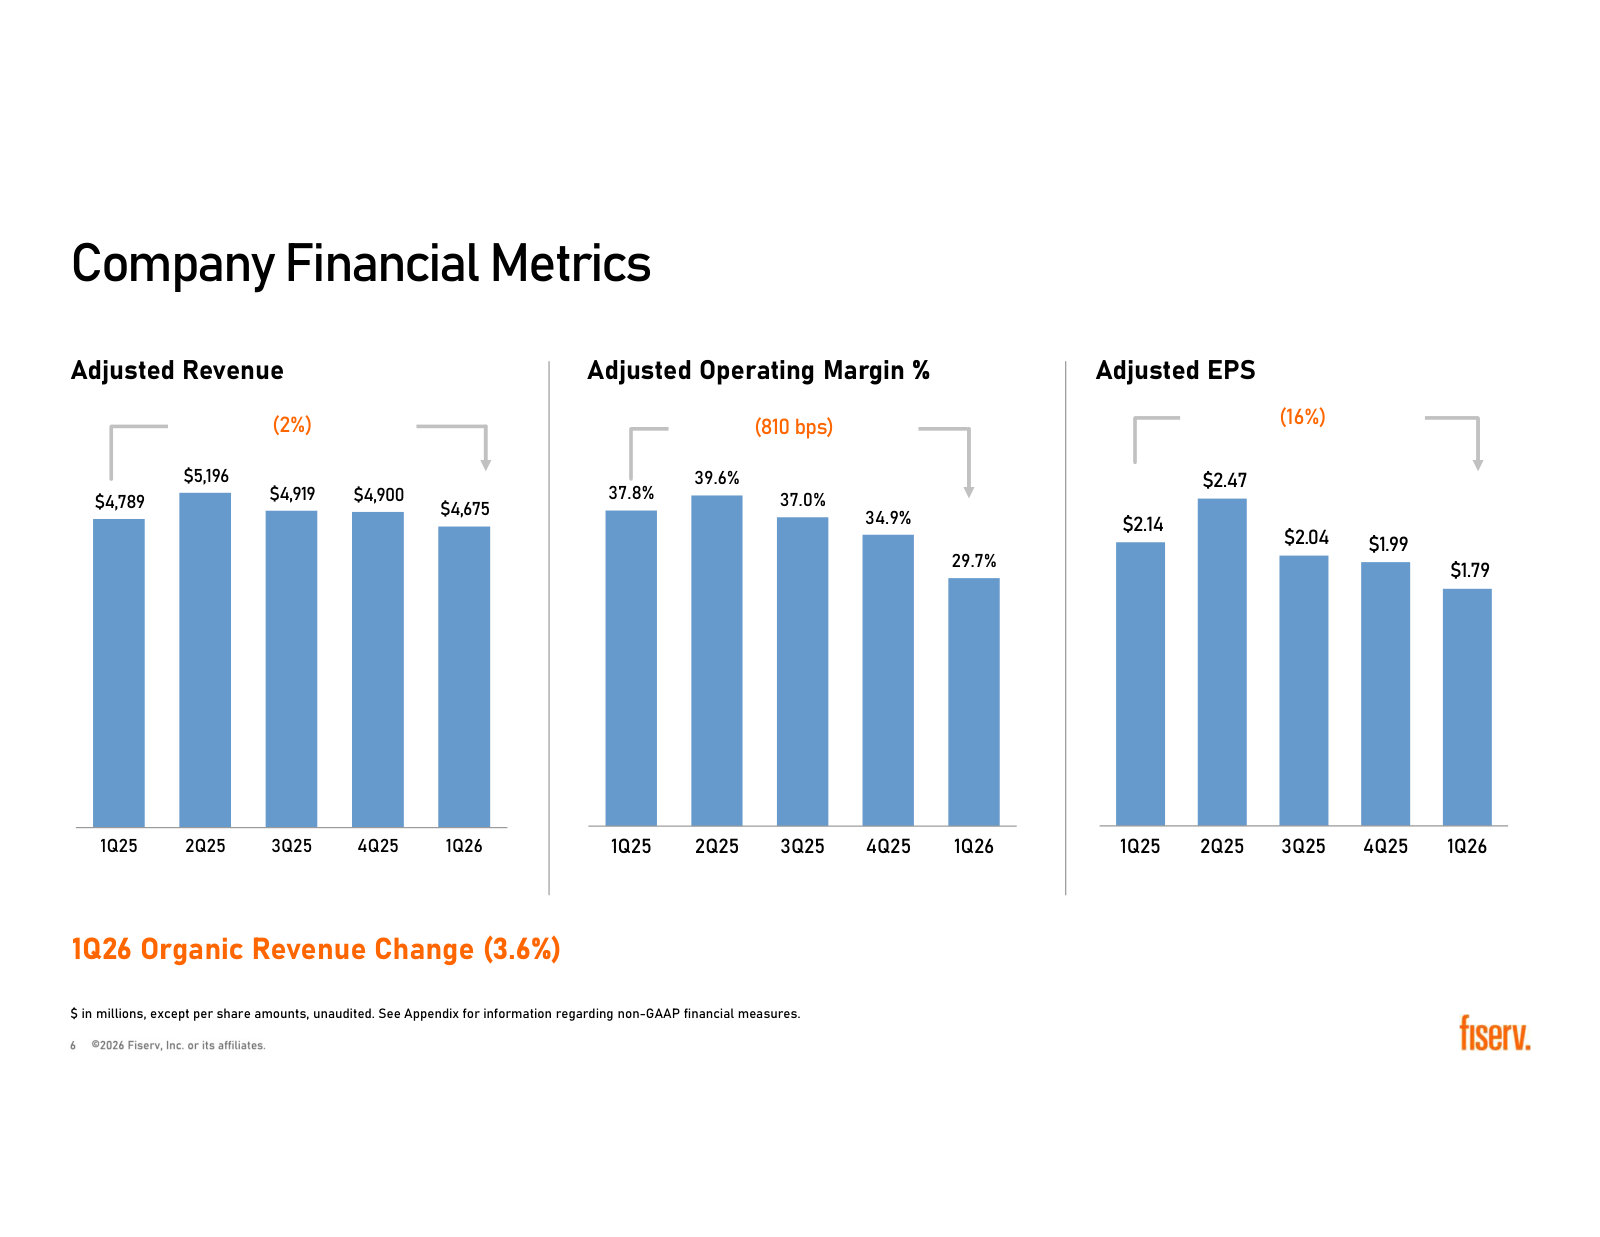
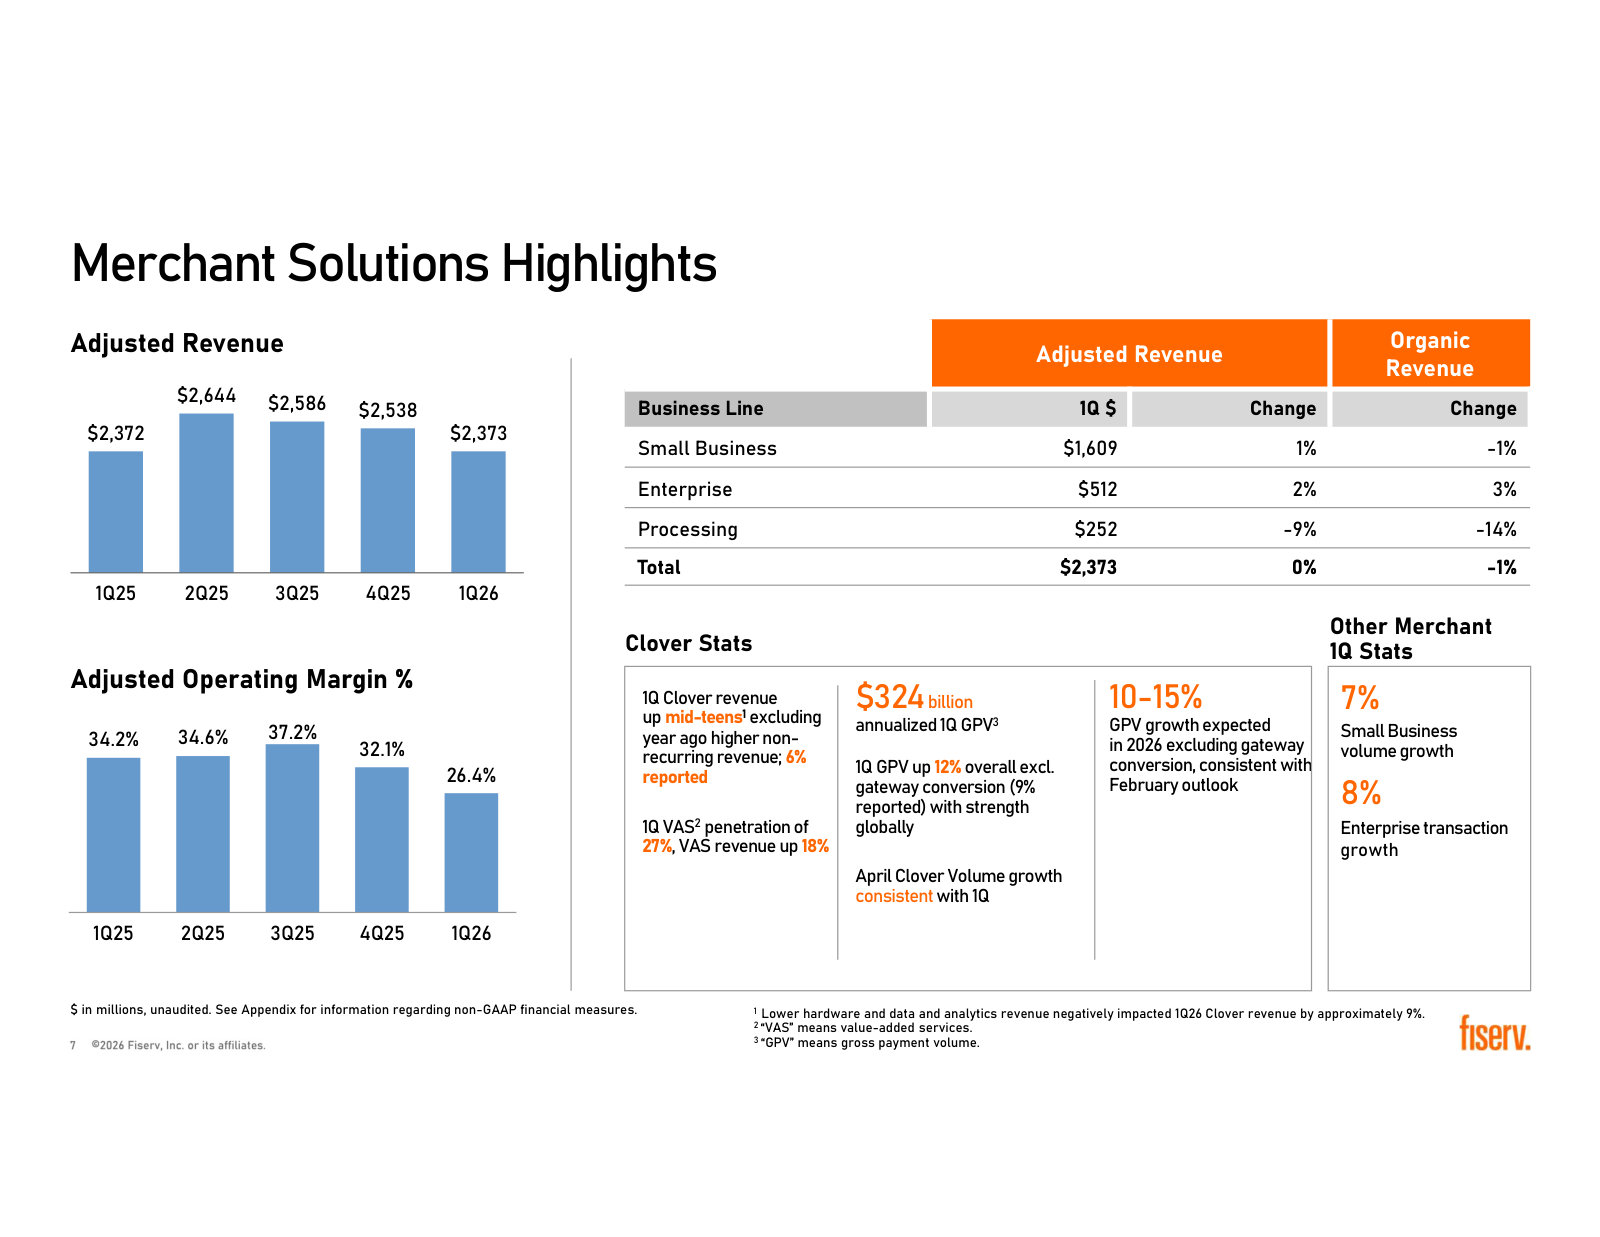
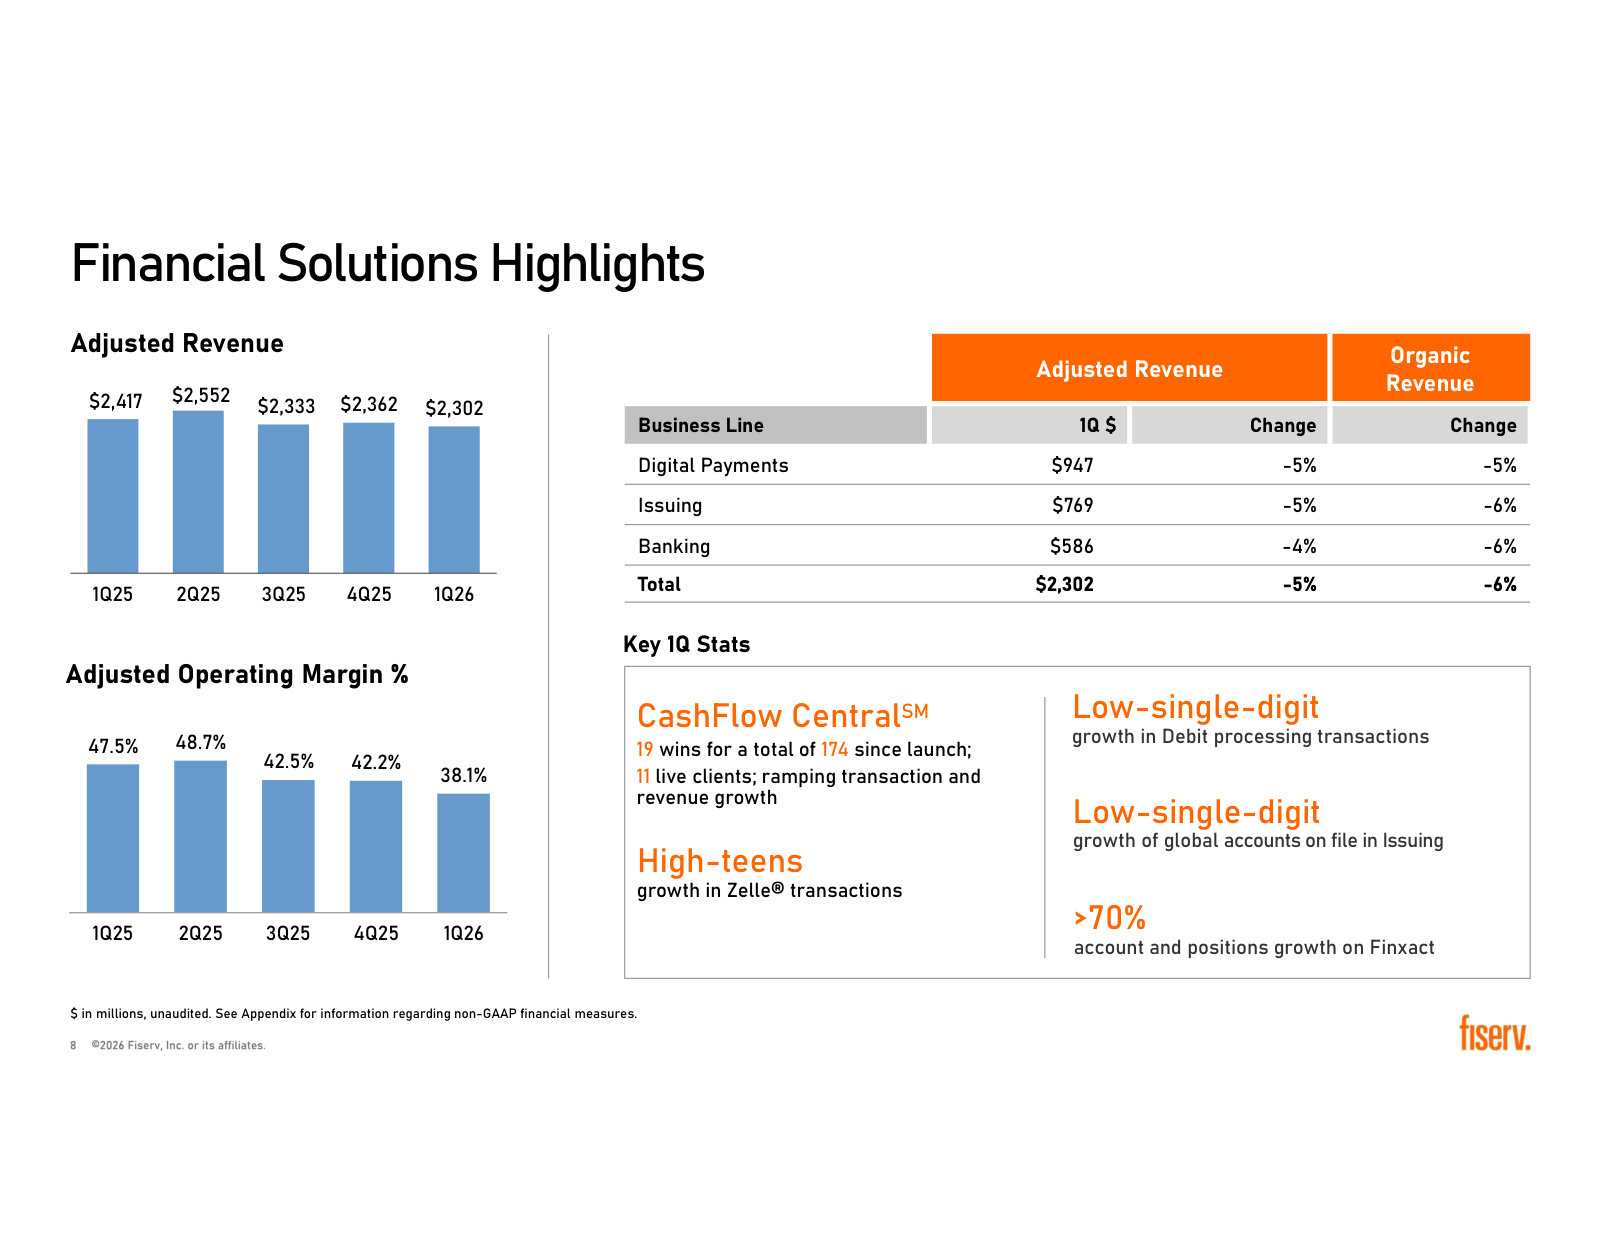
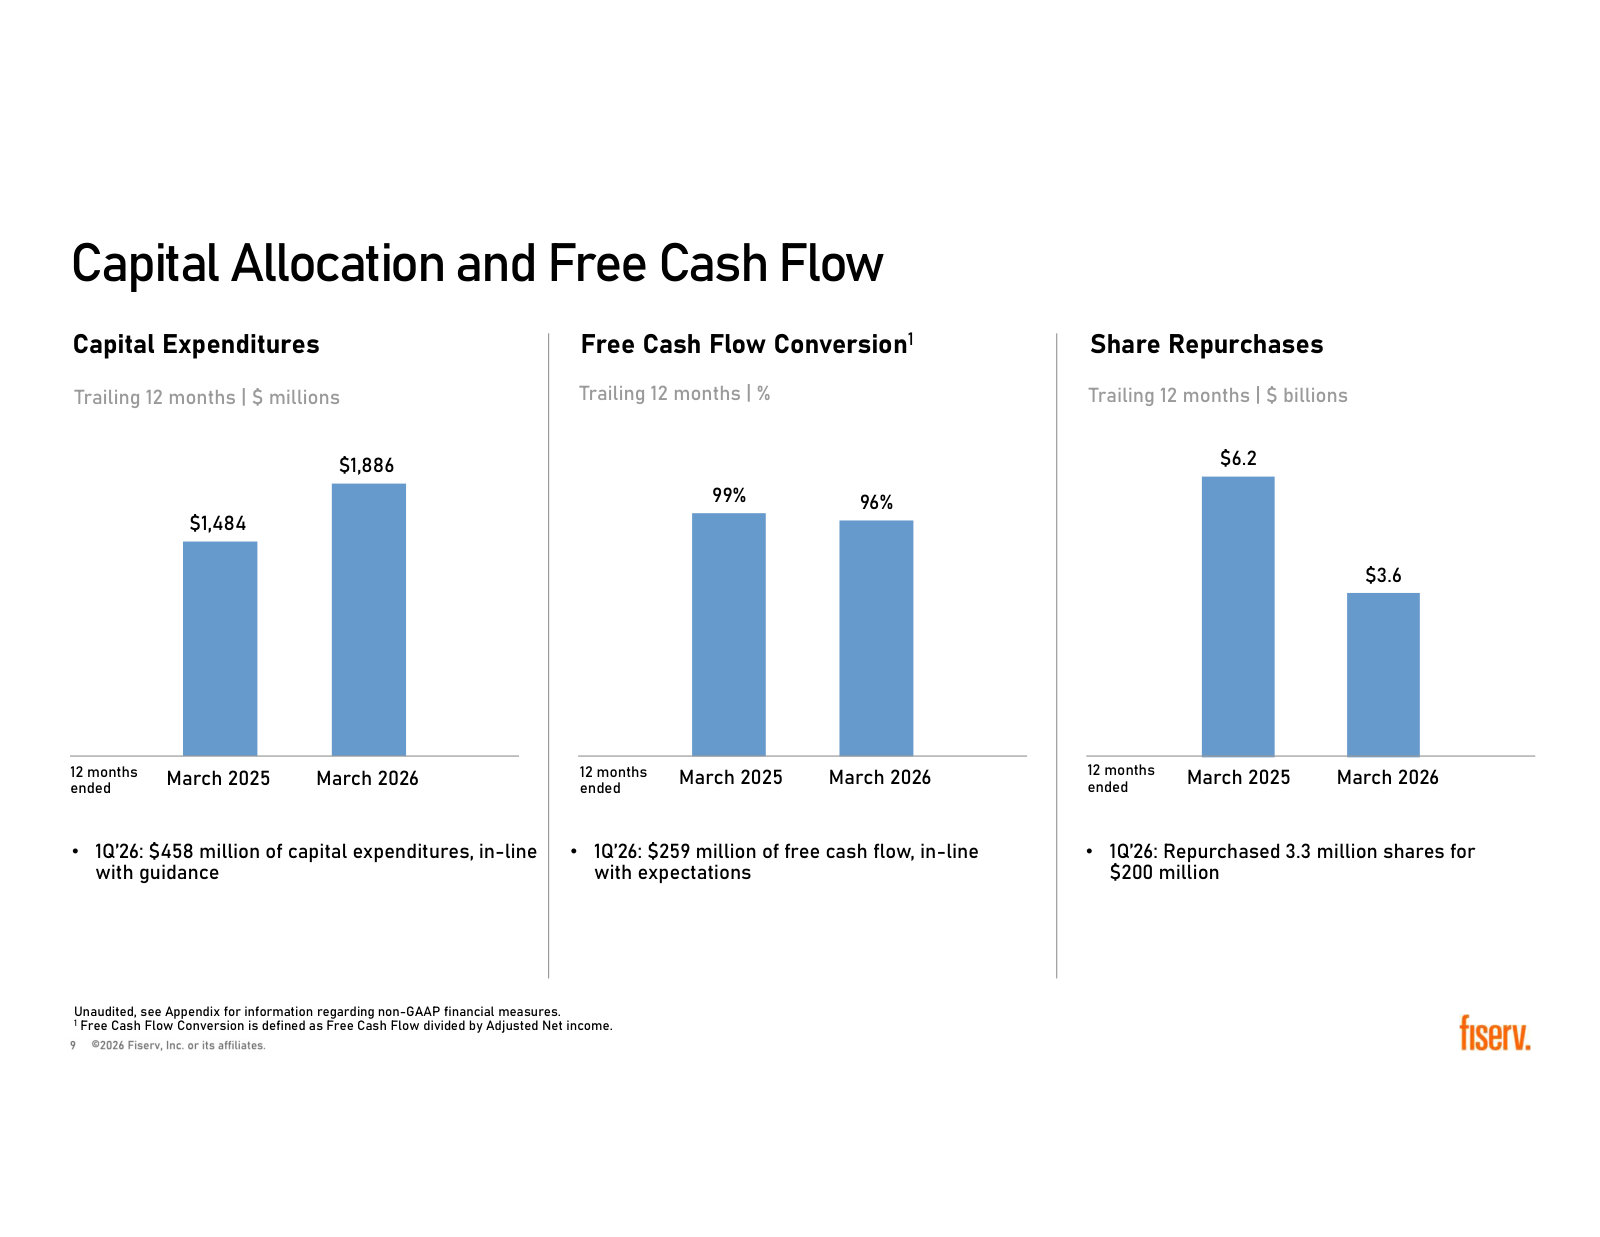
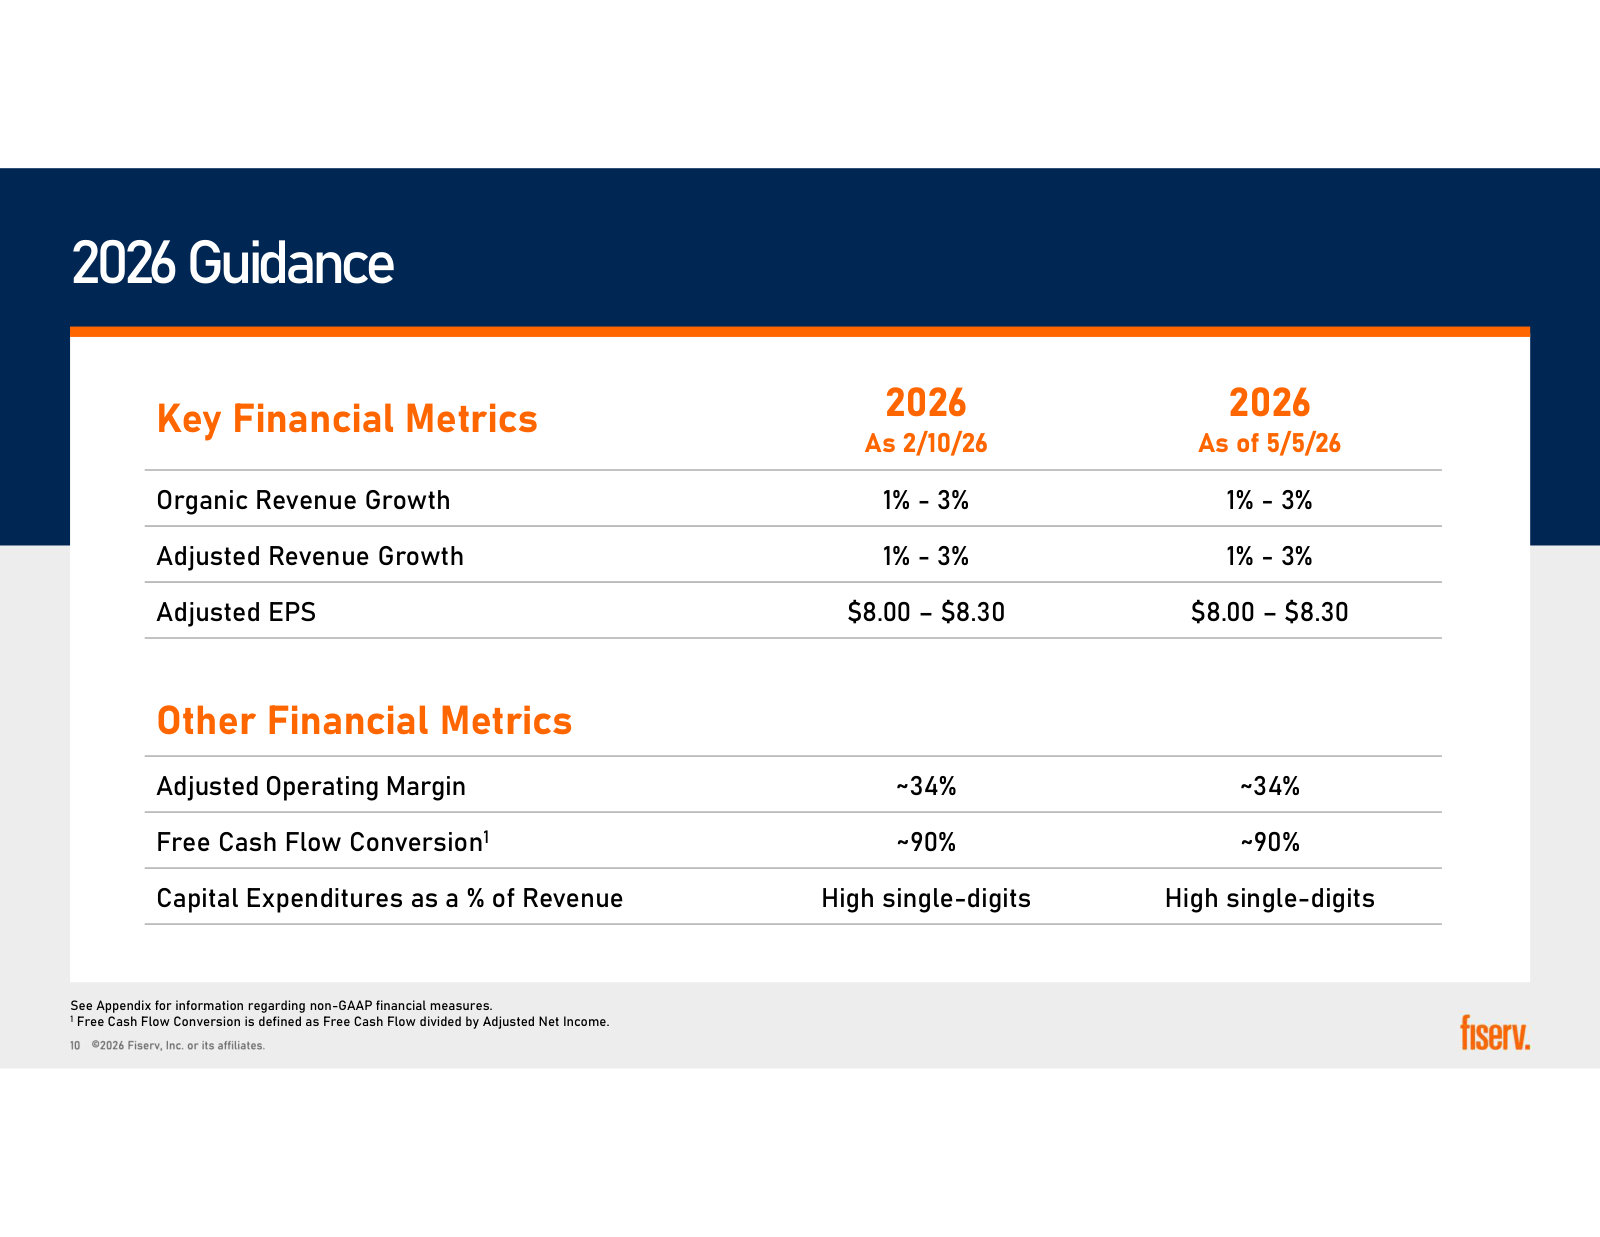
First Quarter 2026 Financial Results — 1Q 2026
The most recent quarterly scorecard, nine days before the Investor Day — current segment revenue, margins and the standing 2026 guidance. · Open the full document →
More from management
Fourth Quarter 2025 Financial Results — FY 2025 · 28 pages · The full-year 2025 segment results and the original 2026 guidance the Investor Day was built on top of. · Open →
Third Quarter 2025 Financial Results — 3Q 2025 · 31 pages · The reset quarter: the rebased outlook, the quarterly Clover volume table and how much of growth was Argentine inflation. · Open →
Fourth Quarter 2024 Financial Results — FY 2024 · 26 pages · The peak-expectations deck: FY24 organic growth of 16% and a 2025 plan of 10-12% growth and $10.10-$10.30 EPS. · Open →
Fourth Quarter 2023 Financial Results — FY 2023 · 24 pages · The FY2023 baseline for anyone rebuilding the segment revenue and margin history from the company's own reporting. · Open →
Fiserv, Inc.'s management answers for the business every quarter. These are the exchanges that explain it best — verbatim, from the call transcripts preserved in Sources. Each link opens the full transcript at that page in a new tab.
Q1 2026 Earnings Call — Q1 2026
Where the turnaround actually stands: what is improving operationally, why none of it is in the numbers yet, and the growth algorithm management now owns. · Open the full transcript →
The definition of a transition year — better execution deliberately held back from reported results by nonrecurring comps and new spend.
Michael Lyons (Chief Executive Officer): So our execution is improving across both businesses, but as expected, that progress is not yet visible in our reported financial results as we are still lapping a higher mix of nonrecurring revenue, fueling the lingering impacts from prior client service challenges and absorbing the incremental expense from investments that will drive long-term client-focused growth, all necessary and important elements of our transition year in 2026. We look forward to the second half of the year and 2027 when we expect our operating performance will be more fully visible in our financial results.
p. 2 · Read in context →
Clover decomposed: 6% reported versus mid-teens underlying, and what each end of the 10–15% GPV range actually assumes.
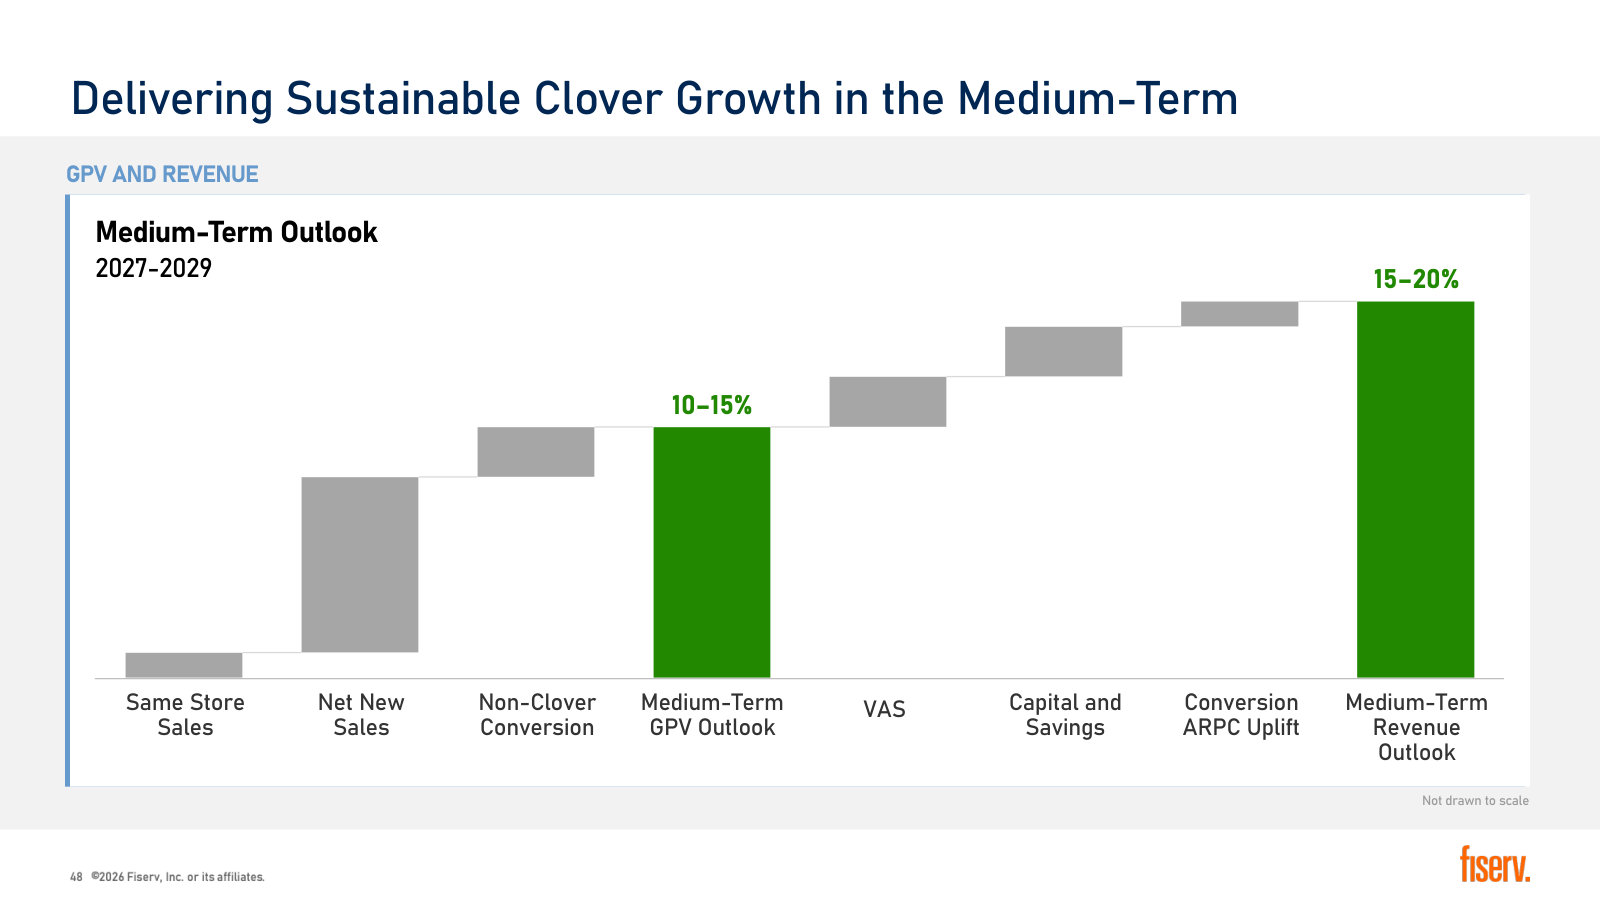
Paul Todd (Chief Financial Officer): Clover revenue grew 6% in Q1. However, excluding higher nonrecurring revenue from the first quarter of 2025, Clover revenue growth would have been in the mid-teens. Clover revenue from Payment Processing grew 10%, more in line with volume trends. As we noted in February, we expect similar trends for Clover in Q2 with this period representing the peak in nonrecurring impacts and also expect that Clover processing revenue will grow in line with Clover GPV. Clover volume grew over 9% on a reported basis and was in line with our expectations as we saw stable growth, both in the U.S. and in key international markets. Clover volume, excluding the previously discussed gateway conversion, grew 12%. As the previously discussed gateway conversion continues to run off, the delta between Clover reported and ex-Gateway growth will converge. We continue to expect Clover revenue growth in the low double-digits for 2026 and GPV growth of 10% to 15% excluding the Gateway conversion. The lower end represents the core growth rate, while the higher end assumes more significant conversion of non-Clover merchants. […] Value-added Services revenue contributed 27% of Clover revenue in Q1, growing 18% from a year ago, driven by software attach and lending, including Clover Capital.
p. 4 · Read in context →
Core-bank attrition answered in full — cause, remedies, and an unforced admission that it is still above target.
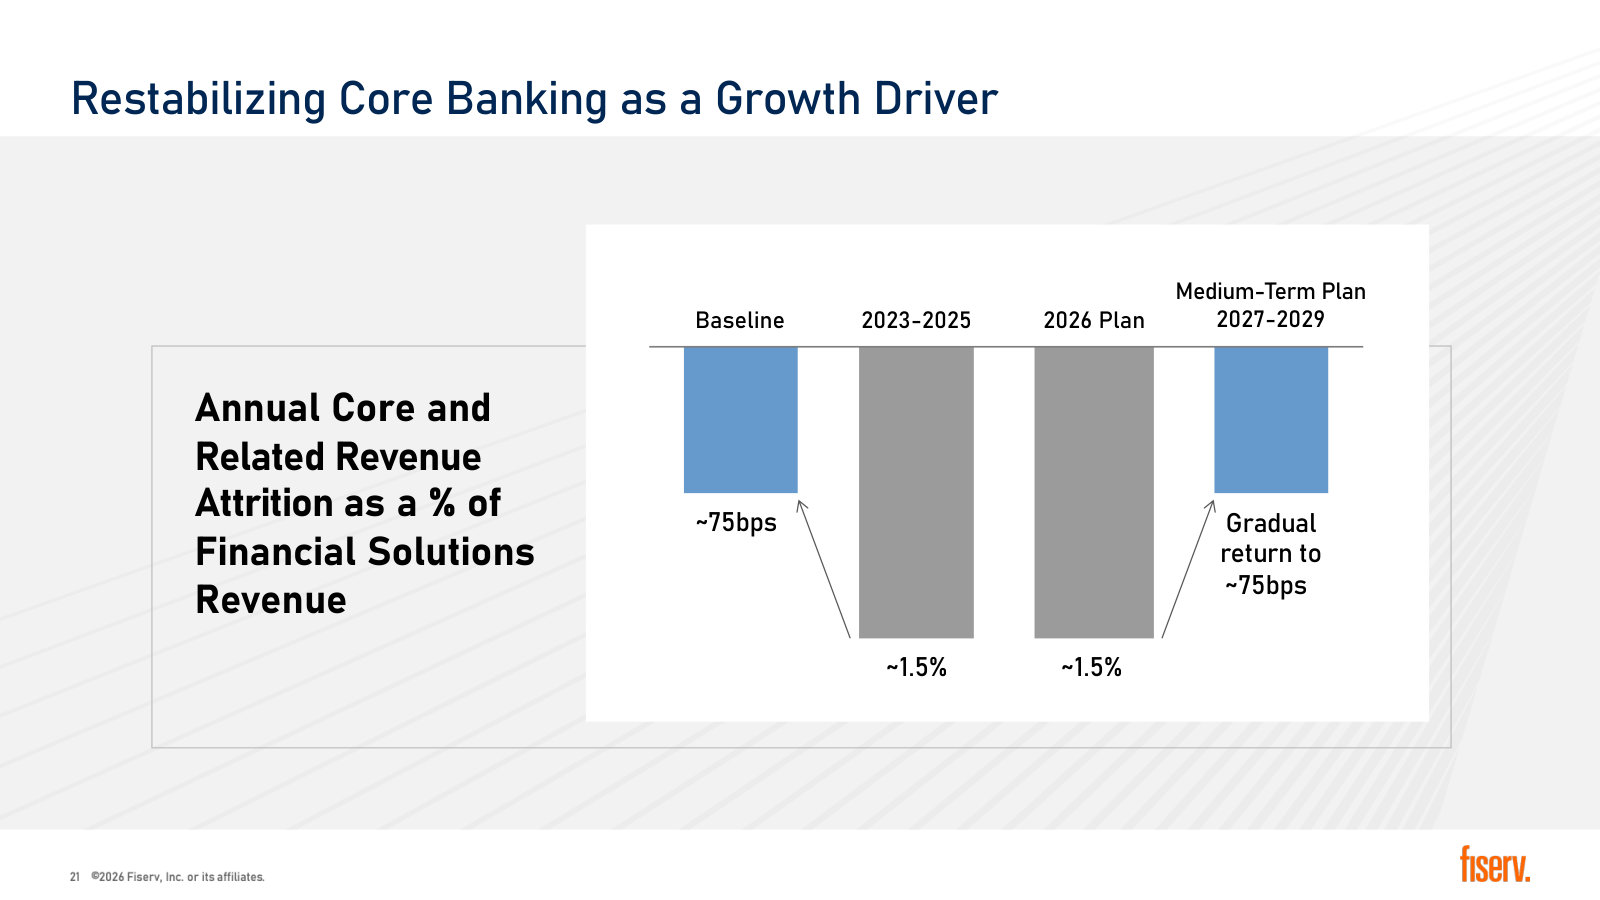
Tien-Tsin Huang (JPMorgan); Michael Lyons (Chief Executive Officer): I wanted to ask just on maybe visibility on the Banking side and retention given some of the bank conversions that you're doing. Just any surprise there? I know the trough comments were made, but I'd love to hear a little bit more detail on attrition and retention, that kind of thing. […] I think broadly on Banking, we continue to be, obviously, very proud of the leading market share position we have in the business and all the support across almost 3,000 banks and credit unions on the core side. As we've said and we said again today, core attrition has been above where we want it to be and getting that back to normal is a significant focus for us. That attrition, as you know, is the result of actions taken over the last several years and especially around the client service front. And we're confident we have the right fixes and the way we're addressing it is the right thing to do. […] Contributing to that is we've significantly increased our client coverage efforts, which was an ask that came directly from the clients. From that has come better service, and we're seeing that show up in both our surveys and anecdotal evidence. And then we've really leveraged a number of different forms of AI to help in call centers, enhancing our client portal experience, accelerating our tech modernization and reducing the books of work we have. Obviously, the decision to support all of our cores was an important one for our clients and has removed a significant amount of perceived pressure for them to switch and obviously, pressure on us. […] I wish it was more visible in the results, but when you go through the underlying KPIs that we have, we feel really good about the progress we're making and our ability to get core revenue-related attrition back down to more normal levels. Ideally we'd like to have none, but of course, you've got M&A and the like. We've had some over history, but getting it back to those historical levels, we feel like we're doing all the right stuff and are on the path to do it; it just takes time and work.
p. 5 · Read in context →
Why the back book is not simply migrated to Clover: conversions wait on vertical capability and a customer-side reason to move.
Paul Todd (Chief Financial Officer); Michael Lyons (Chief Executive Officer) — answering Andrew Schmidt (KeyBanc Capital Markets): Yes, Andrew, thanks for the question. And yes, first of all, I wouldn't call out anything unique as it relates to the back book conversion in the first quarter. And certainly, for the year, we don't have any different expectations around what that back book conversion looks like. We've commented for some time now, we're being very mindful about how we approach any of the non-Clover to Clover transition to make sure that we're doing it in a very mindful customer-centric way. And we've had some good tests around that, around the receptivity of those moves when there's a good product fit. But there is a peaking incremental impact. We've talked about it and the overall Clover GPV guide for the year, the low side of the guide assumes very minimal back-book conversion. And the higher side assumes a more meaningful back-book conversion. But right now, everything is on plan as it relates to how we're looking at that. […] I'd just add that we've said in the past that our ability and willingness to pursue conversions of Fiserv customers from one platform onto Clover depends on us doing certain actions, and we're proud this quarter to launch two new verticals in health care and professional services. Each time we build unique capabilities to address a certain vertical, that allows us a greater opportunity to go in and address the back-book with compelling offers. We don't want to just go in and try to move that to Clover without a strong rationale and mutual benefit for the customer. And as Paul said, our efforts to date have been very modest. Takis will talk you through that study, learn and test approach, and then when we have the right capabilities and the right understanding of it, we could pick up the pace of it.
p. 6 · Read in context →
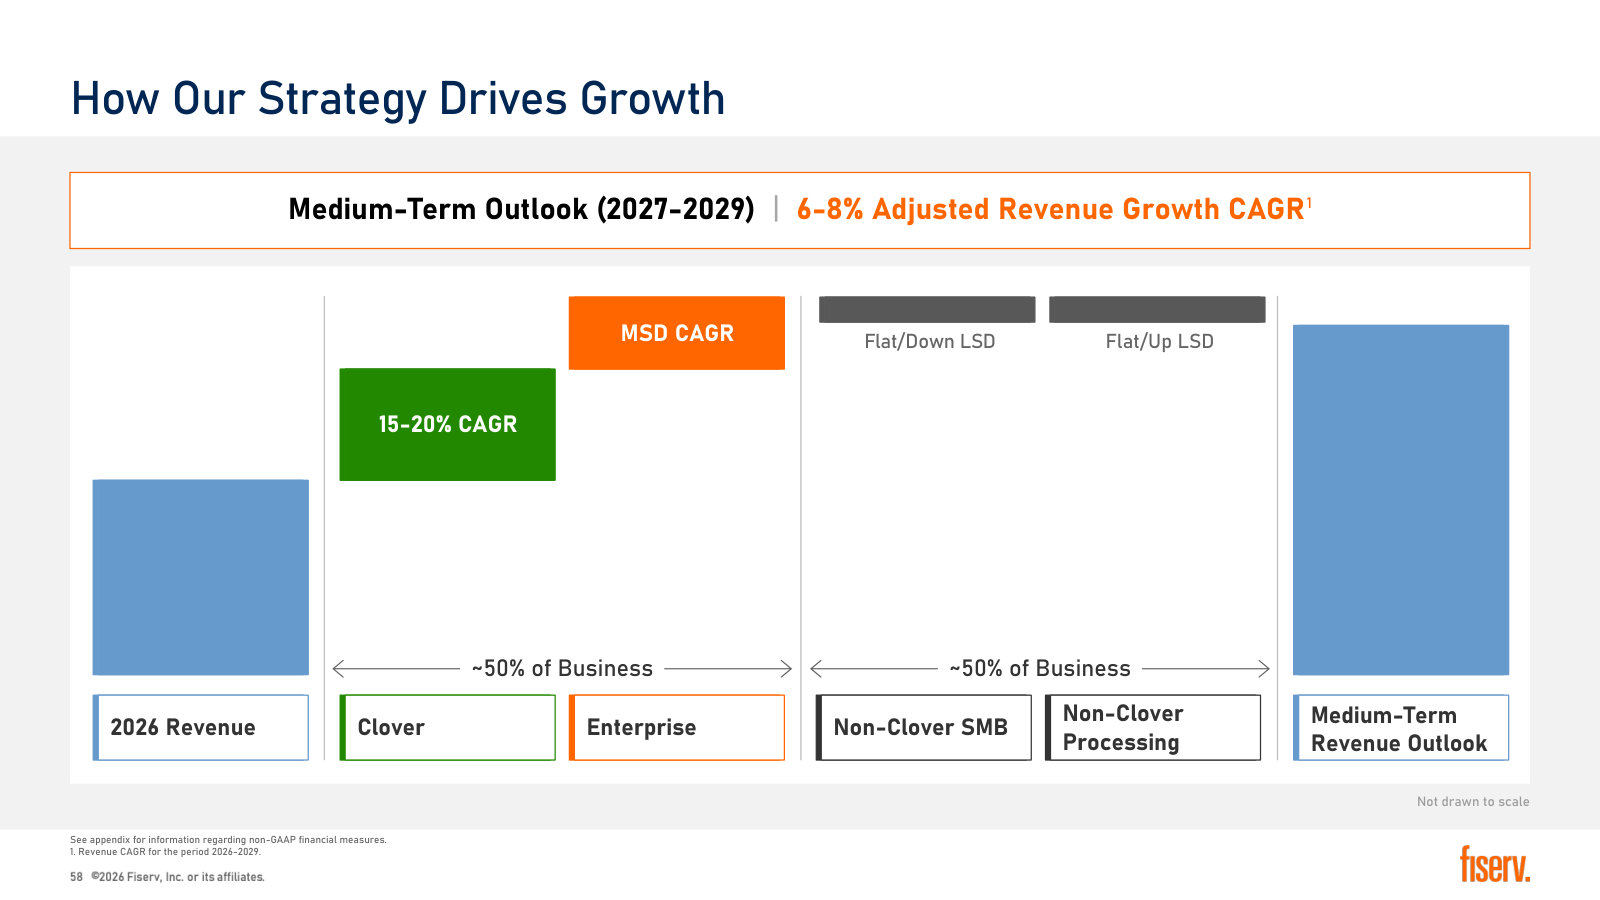
The growth algorithm stated plainly: mid-single-digit company, low-single-digit Financial Solutions, mid-to-high-single-digit Merchant.
Michael Lyons (Chief Executive Officer): It's hard to go through every single recurring revenue item. Broadly, we think, and we'll talk at Investor Day, that we're a mid-single-digit growth company with Financial Solution being a low single-digit growth company, probably operating flattish today on a clean basi and Merchant being mid- to high-single-digit. Our plan is to make the progress visible in the financial results. But to Paul's point, you look at the underlying volumes, they track closely to what we're talking about from a high level and maintaining and growing that volume step—the revenue will come behind it and start to match.
p. 8 · Read in context →
Pressed on whether a flat Financial Solutions can reach the target by 2027, management commits to the actions but not yet to the outcome.
William Nance (Goldman Sachs); Michael Lyons (Chief Executive Officer): Mike, if I could just follow up on the comment you made. I think you've been pretty clear in sort of telegraphing what you think the right growth rate is for the business and the message you expect to deliver at the Investor Day coming up. I'm wondering, to the comment that maybe the underlying growth in Financial Solutions is more or less flat right now, and obviously, the investments that you're making that are weighing on margins right now. As you look out into next year, you've talked about seeing the benefits of some of the improved execution coming through the numbers. Is it your expectation that the company can actually get to that level of performance exiting the year and into 2027? Or are there lingering performance and attrition issues in Financial Solutions or investments you want to make on the margin front that could delay that? […] I'd say go back to the One Fiserv comments: we are confident we're taking the right actions. We have to execute against those and complete them. The team has rallied around those. We're laser-focused on them. We know the fundamentals we have to get in the right place to be a mid-single-digit grower, and the efforts we need to get there are fully funded and fully resourced. We've brought in great talent to complement existing talent. I feel good about the execution plan. We have to go do it. As you exit 2026, you'll start to see comparables shift and become more favorable into Q4, and 2027 is the first full year where you can see clear visible growth. We'll give you more at Investor Day the underlying volume drivers that support our belief. We've got two great TAMs in Merchant and Banking, both in strong positions and investment modes. Whether it's an enterprise merchant or an FI, there's a lot to work on. The environmental support is there, the fundamental volumes are there, and we must put ourselves in a position where execution resilience and service are much crisper than they've been. That's the path we're on, and I'm confident we're taking the right actions to get to where we need to be to position the business to deliver growth. We have to execute.
p. 8 · Read in context →
A rare plain statement about roughly a fifth of company revenue: non-Clover SMB is not a growth business, it is a conversion pool.
Paul Todd (Chief Financial Officer) — answering Timothy Chiodo (UBS): As it relates to organic growth, we do have comparative dynamics—Argentina creates noise. As I said on our last call, we're expecting our non-Clover SMB business to have slight growth this year. We were down low single digits in the first quarter. So organically, we were down in the low single digits for the first quarter and would expect similar performance in the second quarter if everything holds. For the back half, incremental ISV growth is coming in and some international growth, particularly in Brazil, ramps. Generally speaking, non-Clover SMB is not a growth business for us, but relative to the overall picture, we're managing it in a more systemic way than in the past. We're being mindful about how we approach moving that business to Clover over time in the right way. The end goal is to move as much of that business to Clover where the product an features fit those merchants. Takis and team will cover that in more detail at Investor Day.
p. 10 · Read in context →
Q4 and Full Year 2025 Earnings Call — Q4 2025
The first full year built on the reset baseline — the 2026 guidance architecture, where Clover yield comes from, and how much banking share was lost. · Open the full transcript →
How Clover is actually sold — bank referral, ISO and agent, 600 direct sellers — and the first deliberate targeting of non-Clover merchants.
Michael Lyons (Chief Executive Officer): We grew and further diversified Clover distribution channels across the board in Q4, including adding 47 banks to the Clover referral ecosystem, refreshing our merchant relationship with Truist, which will now support businesses of all sizes across the bank's large footprint including 1,900 branches, expanding our industry-leading ISO and agent platforms, continuing to add direct salespeople in North America, where we have over 600 today, launching a new digital tool for our bank partners, which integrates Clover merchan onboarding into the bank's digital banking experience, introducing AI prospecting tools to assist with the identification and conversion of high-value merchants. […] building on the takeaways from prior pilots we began targeting select non-Clover SMB merchants in the U.S. with a Clover offering. While these efforts have been narrow in scope and it's still early, we have seen some promising results with benefits for our clients and higher revenue yield for us. Our efforts here will remain deliberate, ensuring we prioritize the right experience and fit for the client.
p. 2 · Read in context →
What the reset cost in one quarter: fee eliminations were a 6-point Clover headwind, on top of a soft November in restaurant and retail.
Paul Todd (Chief Financial Officer): Clover revenue grew 12% in Q4, 2 percentage points higher than our guidance. There was a 6-point growth headwind to Q4 Clover revenue from the fee eliminations we called out on our last call. Clover volume grew 6% on a reported basis and 9% excluding the previously discussed gateway conversion. Clover volume growth was below our expectations for the quarter, driven largely by softness we experienced in the month of November in the U.S., particularly in the restaurant and retail sectors where we have a large presence. This softness in the U.S. was consistent with broader industry trends and Clover volumes reaccelerated on a combined basis in December and January to approximately 11% ex the gateway conversion. Value-added services contributed 27% of Clover revenue in Q4, up 5 points from a year ago, driven by anticipation, software attach and Clover Capital. Clover revenue finished the year at $3.3 billion, up 23%, while non-Clover small business revenue ex Argentina was flat in Q4 and up 3% for the year.
p. 4 · Read in context →
The whole 2026 guide in one passage — 1–3% organic, a first-half trough, margin shaped 31–32% then 35–36%, ~90% cash conversion.
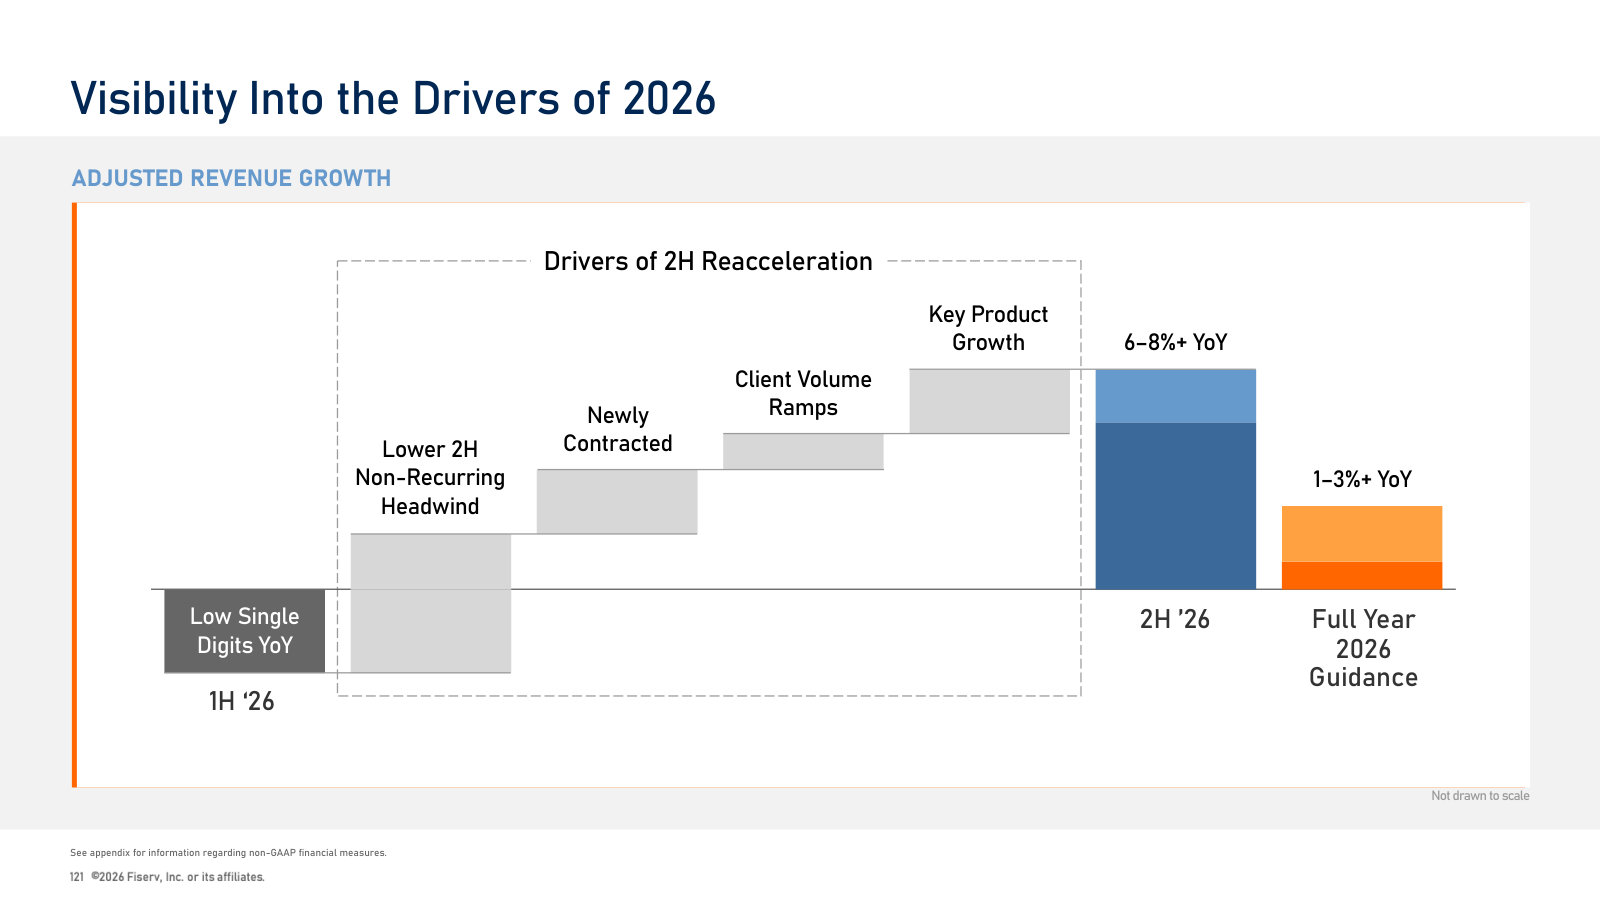
Paul Todd (Chief Financial Officer): We expect 2026 organic revenue growth in the range of 1% to 3% with Merchant Solutions revenue growth in the mid-single digits and Financial Solutions flat to slightly down. Reflecting higher nonrecurring revenue a year ago, we expect adjusted revenue growth in both quarters of the first half of 2026 to decline to the low single digits, with Q2 representing the trough in terms of the rate of decline. […] Putting it all together, we expect adjusted EPS of $8 to $8.30. Similar to our expectations around revenue, we expect a different level of operating margins in the first and second halves of the year. In the first half, we expect adjusted operating margin of 31% to 32%, with Q1 representing the low point just below 30%. In the second half of the year, we expect adjusted operating margin of 35% to 36% with Q4 representing the high point in the year. For the year, this translates into approximately 34% adjusted operating margin. To complete our strategic investments, we expect capital expenditures to remain approximately flat with 2025 levels and end the year with a leverage ratio of approximately 3x. We expect free cash flow conversion of approximately 90% of adjusted net income for the year, in line with historical levels. As always, Q1 will be our trough for free cash flow conversion. Finally, to the extent we generate any excess cash from business and asset optimization activities, we intend to deploy this additional cash to share repurchase.
p. 5 · Read in context →
Where Clover yield comes from: a 15–20% revenue target against 10–15% volume implies value-added services, not price.
Michael Lyons (Chief Executive Officer); Paul Todd (Chief Financial Officer) — answering Andrew Jeffrey (William Blair): I would like to start by expressing our satisfaction with the positive trends we observed in Clover during the fourth quarter. We discussed some of the macroeconomic factors and, more importantly, the advancements we made in line with the Clover business priorities outlined in the One Fiserv action plan. These elements are essential to achieving our aim of establishing what we believe will be the leading small business operating platform. Our goal extends beyond merely facilitating payments; we want to assist small businesses in managing their entire operations. This includes partnerships with Homebase, ADP, and CashFlow Central, and integrating services like Clover Capital to enhance yields for our entire small and medium sized business segment, not solely Clover. We are dedicated to developing our vertical expertise and will be launching initiatives in the healthcare and professional services sectors this quarter. By incorporating more custom and value-added solutions into the Clover platform, we anticipate that yield will increase over time. We are confident in this longterm outlook and are focused on creating a compelling value proposition for the approximately $4 billion in revenue coming from non-Clover small and medium-sized businesses. […] So Andrew, I think it would be fair to say we're very pleased with yield maintenance for 2025 overall, and we don't expect any change really on the yield side in 2026. And you can kind of see that based on our volume growth being in line with our revenue growth on a kind of overall kind of high level. And I think as it relates to go forward, like Mike commented, as we look at like vertical expansions, you would see 15% to 20% kind of growth on the revenue side in the longer term against that 10% to 15% growth, which speaks to a higher yield on a go-forward basis as we penetrate more in Clover Capital, as we do more on the software side. As Mike said, as we do more on the platform side, you'd see kind of that yield maintenance or even slight yield improvement on a go-forward basis so that's consistent with our strategy. And certainly, we'll give more color on that at our upcoming IR Day.
p. 8 · Read in context →
The concrete admission on core banking: the prior forced-conversion strategy cost market share, mostly among smaller credit unions.
Andrew Schmidt (KeyBanc Capital Markets); Michael Lyons (Chief Executive Officer): Just a quick 2-parter on the banking segment. Mike, I hear your comments on the sort of the core client retention. Maybe just a little bit more color on what you're seeing there. It sounds like you've been very proactive in being high touch with clients. And then just beyond the core, can you talk about how you view the portfolio today? Do you need additional capabilities, thinking digital, et cetera? Or do you feel good about where you're at from a capability perspective? […] Thank you for your question. Regarding the core aspect, as mentioned in my opening remarks, we are actively pursuing core modernization. We take pride in our strong market share in core banking and the support we provide to numerous banks and credit unions nationwide. We initiated the core modernization process in 2022, focusing on building a cloud-based, real time, secure API with more open capabilities. This plan is still in effect and is beneficial for all involved. At our Client Forum in September, we made it clear based on client feedback that there are no mandatory conversions in this modernization process. Changes can be made at the clients' convenience. However, due to actions taken over the past couple of years, including previous core conversion strategies, we've lost some market share, particularly among smaller credit unions, which is disappointing in terms of banking segment results. We believe that our new approach discussed at the Forum, along with various client commitment and significant investments in both technology and personnel, will lead to a return to positive growth in banking, which we expect to be in the low single digits. Importantly, we have full control over the solutions and are investing directly to implement them. These are not unsolvable issues; they are necessary steps for our clients.
p. 8 · Read in context →
Why the gateway-conversion drag never cleanly laps, and what the underlying Clover volume growth rate has been through the cycle.
Jason Kupferberg (Wells Fargo); Michael Lyons (Chief Executive Officer): I wanted to come back to Clover for a second. If you can talk about what drove some of the improvement in December, January, you said to 11%. And then the midpoint of your guide for '26 would suggest maybe a little bit more acceleration of this December, January levels so what drove the improvement in December, January? And then what are the drivers of some of the potential further improvement as you go through 2026. And if you can just remind us also when you think we lap the gateway conversion, that would be really helpful. […] Certainly. I’d like to break this down into a few parts. First, December and January returned to our expected performance for the quarter. We anticipated an 11% growth in Q3, but we fell short of that due to the macro weakness we noticed in November, which also affected others in our industry. One of our goals is to improve our yield, but we also want to lessen our reliance on the restaurant and retail sectors, particularly restaurants, which struggled in November. This was a macro anomaly for that month, and we then observed volumes pick up again to what we expected for the quarter, which is encouraging. Looking at the long-term picture, if we exclude the gateway conversion from the past couple of years, our growth has fluctuated between high single digits to low double digits each quarter. In 2025, we maintained growth rates between 9% and 11%, which we believe reflects the core growth of our business, sometimes regardless of macro conditions. Regarding the gateway conversion, it’s important to understand that there isn’t a straightforward anniversary process for it. When we stop converting clients over a gateway, we face ongoing loss over time. As long as we have clients converted to a gateway in the system, any loss from those clients will affect our growth going forward, although the impact will lessen over time. This year, it represented about 3 points, but we expect it to decrease in 2026 and beyond.
p. 9 · Read in context →
Enterprise cleaned up: strip the PayFac network-fee timing and reported −2% revenue becomes +4% against 6% transaction growth.
William Nance (Goldman Sachs); Paul Todd (Chief Financial Officer): I just had a little more here on the enterprise side, you've been calling out the PayFac grow-over issues for a bit now. Just remind us again when those lap and if there's any way of quantifying the magnitude on both revenue and transactions, that would be helpful as well. […] Yes. Will, in my prepared remarks, I mentioned a couple of things about the enterprise. This will be the last quarter we discuss the enterprise transition of this PayFac client, and there was a 6-point differential in the fourth quarter related to this. If you add that to the revenue side, the minus 2% adjusts to about a plus 4%. The 6% transactions figure is a straightforward number on the transaction side, and that 4% revenue growth aligns well wit the 6%. Additionally, that mid-single-digit growth is consistent with what we've observed in the third quarter and what we anticipate for next year. This mid-single-digit transaction growth will also be a good way to view the business moving forward, without the PayFac complications affecting that line.
p. 10 · Read in context →
Q3 2025 Earnings Call — Q3 2025
The reset call. A new CEO rebases growth and margin, quantifies how much of the record was Argentina, and names deferred investment and in-quarter revenue pulls as self-inflicted. · Open the full transcript →
The disclosure that reframed the record: ex-Argentina, organic growth was mid-single digits in both 2023 and 2024, not 12% and 16%.
Michael Lyons (Chief Executive Officer): One of the key takeaways from our analysis is that Fiserv's growth and margin targets need to be reset. This change is driven by a combination of four factors, including slowing cyclical growth in Argentina, the recalibration of optimistic growth assumptions in the original guidance, the impacts of certain deferred investments and the deprioritization of short-term revenue and expense initiatives. I will touch on each of these factors, starting with Argentina, where we have built a highly successful payments business. Fiserv's medium-term organic revenue growth target of 9% to 12% was originally set in 2023 amidst high interest rates and inflation in Argentina, which greatly benefits our anticipation business there and ultimately drove organic revenue growth in Argentina of 257% in 2023 and 329% in 2024. While we have previously sized the impact of excess Argentinian interest rates and inflation on our organic growth, today, we're providing a holistic view of how Argentina has impacted Fiserv's performance. Specifically, Argentina contributed over 5 percentage points to our 12% organic growth rate in 2023 and roughly 10 percentage points to our 16% organic growth in 2024. This is highlighted on Slide 9. Therefore, excluding Argentina, the company's overall organic revenue growth rate was in the mid-single digits in both 2023 and 2024. Year-to-date, Argentina's organic growth rate is 56%, adding roughly 2 percentage points to our overall organic growth rate of just over 5%. Notably, in addition to strong organic revenue growth, our Argentinian business comes with adjusted operating income margins that are roughly double overall Fiserv levels.
p. 1 · Read in context →
The over-earning admission: deferred investment and cost cuts flattered margins, and results leaned on short-term in-quarter initiatives.
Michael Lyons (Chief Executive Officer): The third major factor impacting our results is that over the last few years, decisions to defer certain investments and cut certain costs improved margins in the short term, but are now limiting our ability to serve clients in a world-class way, execute product launches to our standards and grow revenue to our full potential. The good news on this front is that these circumstances are entirely fixable. And with the actions we have taken over the last few months, along with today's announcements, we are making these investments and are on our way back to the highest standards. […] And the fourth and final factor is that Fiserv's recent results have increasingly relied on short-term initiatives. These initiatives place too much emphasis on pursuing in-quarter results as opposed to building long-term relationships by prioritizing business that both meets our clients' needs and comes with high recurring revenue. As a result, we have made the decision to deprioritize these short-term revenue and expense initiatives, which, of course, has some near-term impact on our growth and profitability.
p. 1 · Read in context →
The counterweight management wants held alongside the cut — the problems are described as self-inflicted rather than positional.
Michael Lyons (Chief Executive Officer): Another important takeaway from our analysis is that nothing at Fiserv is fundamentally broken. Our businesses are well positioned. The markets we serve are growing. We are expanding into new Total Addressable Markets (TAM) and our clients have a near insatiable appetite for innovative technology and payment solutions. This reset is about aligning structural versus cyclical growth and sustainable revenues and expenses versus short-term results, particularly as it relates to the company's original guidance. While there are certainly some areas where we are dissatisfied with our recent performance, we found that our challenges are largely driven by our own doing, not the result of a material change in our positioning. We know the issues, and we are already addressing them through investment, more intense focus on operational performance and client service and a significant cultural shift.
p. 1 · Read in context →
The new baseline in numbers: 2025 cut to 3.5–4% organic, and 2026 pre-announced as low-single-digit growth with EPS down modestly.
Michael Lyons (Chief Executive Officer): Turning back to the full year 2025 for Fiserv. We now expect to achieve 3.5% to 4% organic revenue growth based on the revenue-related impacts detailed earlier. We expect full year 2025 adjusted EPS to be $8.50 to $8.60, representing a modest decline year on-year. We will provide formal 2026 guidance with our Q4 results, but we felt it important to note that we expect 2026 will be a critical investment and transition year for us and will mark our new baseline for growth going forward as we take a series of actions, which I'll cover next, as part of our One Fiserv action plan. On a preliminary basis, we expect organic revenue growth to be in the low single digits and adjusted EPS to be down modestly versus 2025. And of course, we'll be going through the normal financial planning process over the next few months to refine this outlook further.
p. 4 · Read in context →
Project Elevate introduced — a two-year AI-led cost and process program run with IBM, with costs and benefits deferred to a later call.
Michael Lyons (Chief Executive Officer): Moving to operational excellence. We are excited to announce Project Elevate, a new multiyear transformation agenda powered by AI. We're executing this alongside our long-term partner, IBM, leveraging the same playbook and the same team that helped them successfully transform their own business and deliver significant value for their shareholders through AI. We launched the program in early September with a focus on five major processes, including sales, client onboarding, Clover client service, HR, and finance. We'll expand the list of processes as we go and expect the program to last approximately two years. The goal is simple: become a higher quality, more productive business by embedding AI in everything we do, including providing a better experience to our clients. While our work is just beginning, early proof points demonstrate the program's strong potential, and we expect compelling returns on our investment.
p. 4 · Read in context →
Three one-offs inside a single EPS print — Argentine devaluation, Argentine interest, and a JV termination gain that nearly offset both.
Paul Todd (Chief Financial Officer): There are three unusual dynamics impacting the company's adjusted EPS of $2.04 for the quarter. First, the company experienced a $53 million foreign currency expense or a $0.10 headwind to adjusted EPS. Revaluation of certain assets and highly inflationary countries such as Argentina is recorded through the income statement. During the third quarter, the foreign currency exchange rate in Argentina devalued significantly, resulting in this large expense. Second, Argentina interest rates jumped meaningfully during the quarter, which drove interest expense up about $31 million above last year or a $0.04 headwind to adjusted EPS. Finally, during the third quarter, Fiserv completed the mutual termination of a merchant alliance joint venture. This resulted in a tax-free gain of $89 million recorded in Merchant Solutions' operating income resulting in a $0.16 tailwind to adjusted earnings per share. We continue to provide services to this partner through a processing relationship. The net of these three factors is a slight benefit to adjusted earnings per share in the quarter.
p. 6 · Read in context →
Asked how long Fiserv had been over-earning, management gives the ex-Argentina series: 6%, 6%, then 3% year-to-date.
Tien-Tsin Huang (JPMorgan); Michael Lyons (Chief Executive Officer): Lots to ask here. Just maybe, Mike, I'll ask it this way. How long was Fiserv over-earning with deferred investments and this focus on short-term revenue and expense initiatives that you called out? And of course, it's early. But how long will it take? And at what cost for Fiserv to reverse this and get back to what I call a hallmark of double-digit EPS growth, you did call that out double-digit EPS growth. And of course, I'm getting the question to you, given your analysis and over the last few months, is double-digit EPS growth the right target? And why are you confident that that's the case? […] Removing Argentina from the analysis, if we look at the growth rates for 2023, 2024, and year-to-date in 2025, we see 6% growth, 6% growth, and 3% growth, respectively. While there are some fluctuations in these figures due to the short-term initiatives, they reflect our current position as a company that is capable of mid-single-digit growth, likely on the lower end of that range. We've also recognized specific areas for improvement within our businesses, and we are already addressing these with targeted investments. We recently presented to 4,500 clients and made commitments to enhance our focus on these issues. We realized many of the challenges were self-imposed, but we know how to resolve them. We've made leadership changes to better manage these businesses, bringing in two highly effective leaders with proven track records. Our perspective is that we currently have low mid-single-digit growth, with a clear path through our investments to achieve more solid mid-single-digit growth and the potential for further acceleration. We'll provide updated medium-term guidance during our Investor Day, but our free cash flow generation remains strong. Our capital management strategy hasn't changed; we plan to invest organically and make selective acquisitions, and we'll continue to buy back shares as needed. We're maintaining our leverage guidelines, which together support our objective of achieving double-digit EPS growth. We're focused on operating the business effectively, maintaining high execution standards, serving our clients well, and ensuring long-term value for our shareholders. That's the overview I wanted to share.
p. 8 · Read in context →
Financial Solutions rebuilt from the parts: core banking low-single-digit, issuing low-to-mid, adding to mid-single digits over time.
Michael Lyons (Chief Executive Officer) — answering Darrin Peller (Wolfe Research): Yes, I’ll address the last part first and then Paul will provide specific numbers. We have completed our review and while we continue to learn, the pace of learning has stabilized. We are very confident that the figures and baseline we are providing today accurately represent the current state of the company. We are assembling a leadership team to complement our existing team, enabling us to execute effectively. I have strong confidence in the numbers we are sharing today. We have thoroughly evaluated the company and sought external insights. While we recognize that not everything is perfect, there are areas needing improvement. However, at the moment, we are focused on sustainable growth beyond cyclical factors. For instance, despite cyclical influences like those seen in Argentina, we believe that we can grow faster than mid-single digits. In terms of our two business segments, it's important to analyze them separately. We have a top-tier issuing business within banking that is gaining market share and is foundational to our strategy in the fast-evolving embedded finance sector. With platforms like Finxact, Commerce Hub, and the Payfare acquisition, we see substantial potential in the digital commerce and payment landscape. Regarding our core banking segment, there are certain areas performing exceptionally well, while others, as we discussed at the forum, have not met our execution standards. We need to consolidate our core systems from sixteen to five; this is crucial for modernizing our technology for our clients, and while we haven’t executed this perfectly, we’ve corrected our course. Currently, this should yield low single-digit growth in that segment. There are promising developments with our surrounding offerings, like XD and CashFlow Central, but we need to improve our execution to bring these products to market more effectively. In summary, our core banking business is expected to grow in low single digits, and our progress with Finxact is strong as we gain new customers. The issuing business is also performing well in that low to mid-single-digit range. When we combine these components, we project a mid-single-digit growth trajectory over time.
p. 9 · Read in context →
The hardest question on the call — how a recurring-revenue segment broke two months after the July reset — and the direct answer.
Harshita Rawat (Bernstein); Michael Lyons (Chief Executive Officer): Mike, I would like to follow up on the Financial Solutions business. I acknowledge the recent expectations reset and the deprioritization you mentioned. However, I want to inquire about the third quarter. You reduced the full-year guidance three months ago when the quarter had just begun. Back then, I believe we learned that the team had re-evaluated everything. I’m trying to understand how things could change so dramatically in just two months in a segment that is essentially recurring. Additionally, I’m curious about the lack of visibility regarding this significant level of revenue weakness during the quarter. […] I appreciate the question and understand it. This was not a reset I anticipated. In July, about 10 weeks into my role, I focused on underwriting some key projects that were contributing to the company's original 10% to 12% growth guidance. We successfully reevaluated those larger projects, and their performance has generally stayed on track since then. However, as we faced unexpected financial surprises at the start of Q3, it led to a more thorough review of our financials, prompted by feedback from our clients. This analysis revealed some additional assumptions that needed reassessment, including factors that were largely beyond our control, such as macroeconomic conditions and industry trends that we initially expected to behave differently. We also identified various assumptions outside of the major projects that, even with effective execution, would have made it challenging to accomplish everything concurrently. Along with significant productivity initiatives and sales activities, there were numerous shorter-term initiatives driven by our clients' businesses that were crucial for meeting our guidance. Gaining a deeper understanding of these factors led to some dissatisfaction with our processes, resulting in leadership changes. Today, I believe we have established a solid baseline for growth. The original 10% to 12% guidance has been thoroughly examined over the past five to six months. I am confident that the numbers we have now accurately reflect our company's structure, and we've provided an outlook from which we can grow, backed by a team ready to effectively execute the business, which is an excellent operation to manage.
p. 12 · Read in context →
Q2 2025 Earnings Call — Q2 2025
The first crack, before the full reset — guidance cut to the low end and called a timing issue, plus the clearest account of Clover unit economics in the corpus. · Open the full transcript →
The July framing, withdrawn one quarter later: the initiatives are fine, only the timing of realising them has moved out.
Michael Lyons (Chief Executive Officer): The 2025 guidance, which called for 10% to 12% organic revenue growth on top of the 16% growth we achieved in 2024, had always assumed a significant growth ramp on the back half of the year. This trajectory was based on the successful launch of a long and granular list of new products and strategic initiatives as well as a relatively strong macroeconomic outlook. Our updated guidance reflects the fact that some of those launches and initiatives are taking longer than we had planned. Some of that is on us and some is driven by other factors that we don't fully control, but we are confident that we will capture the full strategic and financial benefits, and only the timing of realizing them has been extended. And to a lesser degree, our update reflects economic conditions that we have seen versus what had been assumed in the plan. As a result, we have refined our full year organic revenue growth guidance to approximately 10%, which is at the low end of our guidance range. And to be clear, we are maintaining our guidance for $3.5 billion of Clover revenue this year. With this revised ramp in revenue growth in the back half, continued margin improvement, and the increased share repurchase guidance, we are also refining our adjusted EPS guidance by raising the bottom end of our range by $0.05.
p. 1 · Read in context →
Clover revenue broken into its three sources — value-added services penetration, hardware, and pricing — against 8% reported volume.
Michael Lyons (Chief Executive Officer): Let's start with Clover, where Q2 volume growth came in line with our expectations at 8% reported and 11% excluding the gateway conversion. As a reminder, for operational reasons, we converted merchants from a non-Clover payments gateway to Clover ending in 2024. The 11% represents the growth rate of Clover without the converted portfolio. With respect to the second half of 2025, we expect Clover volume growth, both on a reported basis and excluding the gateway conversion, to accelerate from Q2 levels. These levels are consistent with our plan to reach $3.5 billion in Clover revenue for the year. Clover revenue grew 30% in Q2, highlighting the strength of our full business operating system approach. There are three key contributors to Clover's revenue. First, VAS penetration of 24%, which was up from 20% a year ago. This was in line with Q1 levels and demonstrates good progress towards our year-end goal of 25%. Total VAS revenue grew 52%, driven by both software sales and capital, which includes Clover Capital and anticipation in Latin America. Second, hardware sales remained healthy and within the expected long-term range of revenue contribution. And finally, pricing and other services, including data.
p. 2 · Read in context →
Clover Capital under-penetration framed as a deliberate risk-appetite choice, not a capability gap — less risk taken than competitors.
Timothy Edward Chiodo (UBS); Michael Patrick Lyons (Chief Executive Officer): I want to start by digging into Clover Capital a little bit more. So you've talked about being meaningfully underpenetrated versus some of the peers when we look at Toast and Square. We would agree that you are well below their penetration levels in capital. Could you talk a little bit about some of the activities that you're doing to unlock that TAM? In other words, we gather that with some of the wholesale ISOs or potentially bank partners, you're not able to access the full set of merchants to sell them Clover Capital, and we gather there are things that are happening to help unlock some of that. Maybe you could put some context around that level of penetration today and where you could see it getting to over the medium term. […] Penetration is very low in both our non-Clover SMB base and our Clover SMB base. We are careful with our risk management and have implemented various practices regarding offer operations, merchant negotiations, presentation, and pricing for Clover Capital. We have begun making refinements this quarter but are still in the early stages of developing a comprehensive approach to Clover Capital. We believe there is significant potential for growth within our current risk appetite, and perhaps we can expand that appetite over time. Given our current penetration rates, we are taking less risk than our competitors. We see Clover Capital as a valuable product for our merchants; they appreciate it and rely on it. The total addressable market is significant, and we plan to make several operational, pricing, and risk management decisions in the coming months and quarters, expecting positive progress.
p. 7 · Read in context →
Ten weeks into the job, the CEO explains the cut; the CFO then walks the merchant margin down through CCV dilution and sales investment.
Michael Patrick Lyons (Chief Executive Officer); Robert W. Hau (Chief Financial Officer) — answering Darrin Peller (Wolfe Research): Yes, it's Mike. I'll begin by discussing the overall organic growth rate for the company, which we have adjusted to approximately 10% from 10% to 12%. I’ve been in this role for about 10 weeks, and I’ve had the chance to gain a clearer understanding of the main drivers of our business, the status of our strategic initiatives, and what was included in our full year guidance. This guidance always expected significant growth in the latter half of the year due to the rollout of several projects and initiatives. We have a comprehensive and strong list that we have thoroughly evaluated, and these initiatives are promising. It is mainly about the timing of bringing them to market. As I mentioned earlier, we remain confident in achieving the full financial and strategic benefits of these initiatives; it’s just a matter of when they will be implemented. The product pipelines we are about to introduce are robust, our clients are interested, and the technology is sound, which gives us a lot of confidence. The adjustment from 10% to 12% down to 10% reflects our insights gained after 6.5 months into the year regarding our product rollouts and our emphasis on quality during these rollouts. The forecast indicates growth of 12% in the latter half of the year, leading us back to the lower end of our original guidance range. […] Regarding merchant margin, in the second quarter, we experienced a decline of about 200 basis points, primarily due to a challenging comparison with last year's second quarter, which saw significant growth. However, the margin for Q2 2025 is at 34.6%, representing a 90 basis point increase from two years ago. We still see avenues for margin growth and business expansion, and we continue to invest in that area. In my prior comments, I mentioned some investments made this quarter in marketing, sales, and distribution, which are contributing to solid growth in both our ISV and direct businesses as we enhance our capabilities. The recent acquisition of CCV, which closed at the end of Q1, is also influencing our overall merchant margin this quarter. Typically, acquisitions begin with below-average company margins, but we aim to scale and improve them through integration and synergies over time. We are about 90 to 120 days into this acquisition, which has definitely impacted the quarter’s margins. Additionally, I want to highlight our increased investments in software and hardware. We recently launched new vertical software like Clover Hospitality and have made several announcements, including partnerships with Homebase, Rectangle Health in healthcare, TD, and Adobe. All of these initiatives involve investments in product development, implementation, and market strategies, and we are committed to supporting these new growth opportunities.
p. 8 · Read in context →
Guidance philosophy laid bare: the 12% top end always assumed a better macro, so a choppier one lands the year at the bottom of the range.
Tien-Tsin Huang (JPMorgan); Michael Patrick Lyons (Chief Executive Officer); Robert W. Hau (Chief Financial Officer): Just wanted to get a little more detail on what initiatives are being extended exactly. And I think, Mike, you mentioned that some of it was on Fiserv. Can you elaborate on that and what you're doing to address it? Is it a budgeting issue? Or is there something more specific to that? Just trying to like Darrin ask, give a little bit more understanding on your conviction on the new outlook. […] Yes. As I was just saying, we went into the year, the year was built on a back half of the year plan with a lot of granular, very attractive, very compelling initiatives, no major one or two items, but a very long list of initiatives. And as you go through the planning and have the benefit of half the year and you look at where the rollout of those initiatives are in terms of timing and how we want to do it in terms of quality for the client, scalability, and a client-first mindset. And then you roll forward the rest of the year, it puts us at the bottom end of the original 10% to 12% range just in getting those products to market and realizing the revenues. There isn't a quality issue with them. It's not products that have gone to market and not generated the revenues we thought it's just getting the products to market. And as I said, some of that we control. We can execute faster, better, greater sense of urgency, and some of it we don't because we're integrating with partners, contract signings, how do people respond to an uncertain macro in the second quarter, obviously, more clear now. […] Tien-Tsin, I think the way I think about it is our original guidance at 10% to 12%, our baseline plan was midpoint, 11%. To get to 12%, we factored in the opportunity for a slightly better macro environment, a little bit faster business, some of the credit and course surrounds that Mike just talked about that would have gotten us a little bit faster, stronger would have gotten us to the top end. And now that we've seen a bit choppier recovery in the macro economy, a little bit slower on the initiatives, again, both on things inside and outside of things in our control and outside our control, a little bit slower, puts us at the bottom end of the range, which is what we're guiding to at this point.
p. 9 · Read in context →
The Clover revenue targets restated — $3.5bn for 2025, set three years earlier, $4.5bn for 2026 — and what must keep working to hit them.
William Alfred Nance (Goldman Sachs); Robert W. Hau (Chief Financial Officer): You've expressed a lot of confidence in the ability to hit the $3.5 billion revenue target in 2025. I know that you guys had some targets out for 2026 as well. I don't think you've addressed those. And if I look at where the Street is, Street, I think, is still comfortably below those targets, roughly 24% revenue growth next year. So just wondering if you can maybe address that and talk to the confidence in hitting that? And if not, the Street numbers are already kind of below it. Like what do you think is a reasonable revenue growth rate for a kind of low double-digit volume growth dynamic in Clover, given some of the initiatives you've got on the VAS and the capital side, but also maybe considering what seems to be a pretty strong year for hardware sales, which may be less recurring as we look forward? […] Yes. Thanks, Will. So certainly not updating 2026 guidance at this point, but I would certainly point to a couple of key things. First and foremost, we laid out the $3.5 billion goal for 2025 about three years ago, and we are exactly on track to deliver just that. We need to continue to do what we did in the first half to deliver the second half to get to $3.5 billion. Obviously, there's continued growth to get to the $4.5 billion. That's a number we put out about 1.5 years ago or so. But the things that we are doing now that help us deliver the $3.5 billion put us in a good position to deliver the $4.5 billion next year. Things like the horizontal expansion with Homebase, adding ADP and CashFlow Central capabilities into Clover, the vertical expansion, adding Clover Hospitality, Rectangle Health for what we're calling PracticePay and a new health care vertical. The international expansions, we talked about the benefit of Brazil. We continue to see growth across all five of the new international regions. It's very early stages. So you're getting a little bit of benefit this year. That continues to accelerate into 2026 and beyond. And then we're also expanding our distribution channels with the announcement of the US Foods, for example, a new sharing partner, TD Bank, building out our direct channel. So absolutely online to deliver $3.5 billion, a number we set out three years ago and things that we're doing this year help us grow the balance of this year, second half as well as into 2026.
p. 11 · Read in context →
Clover framed as a business operating system with under 10% U.S. share, and a flat rejection of the idea that hardware is a loss leader.
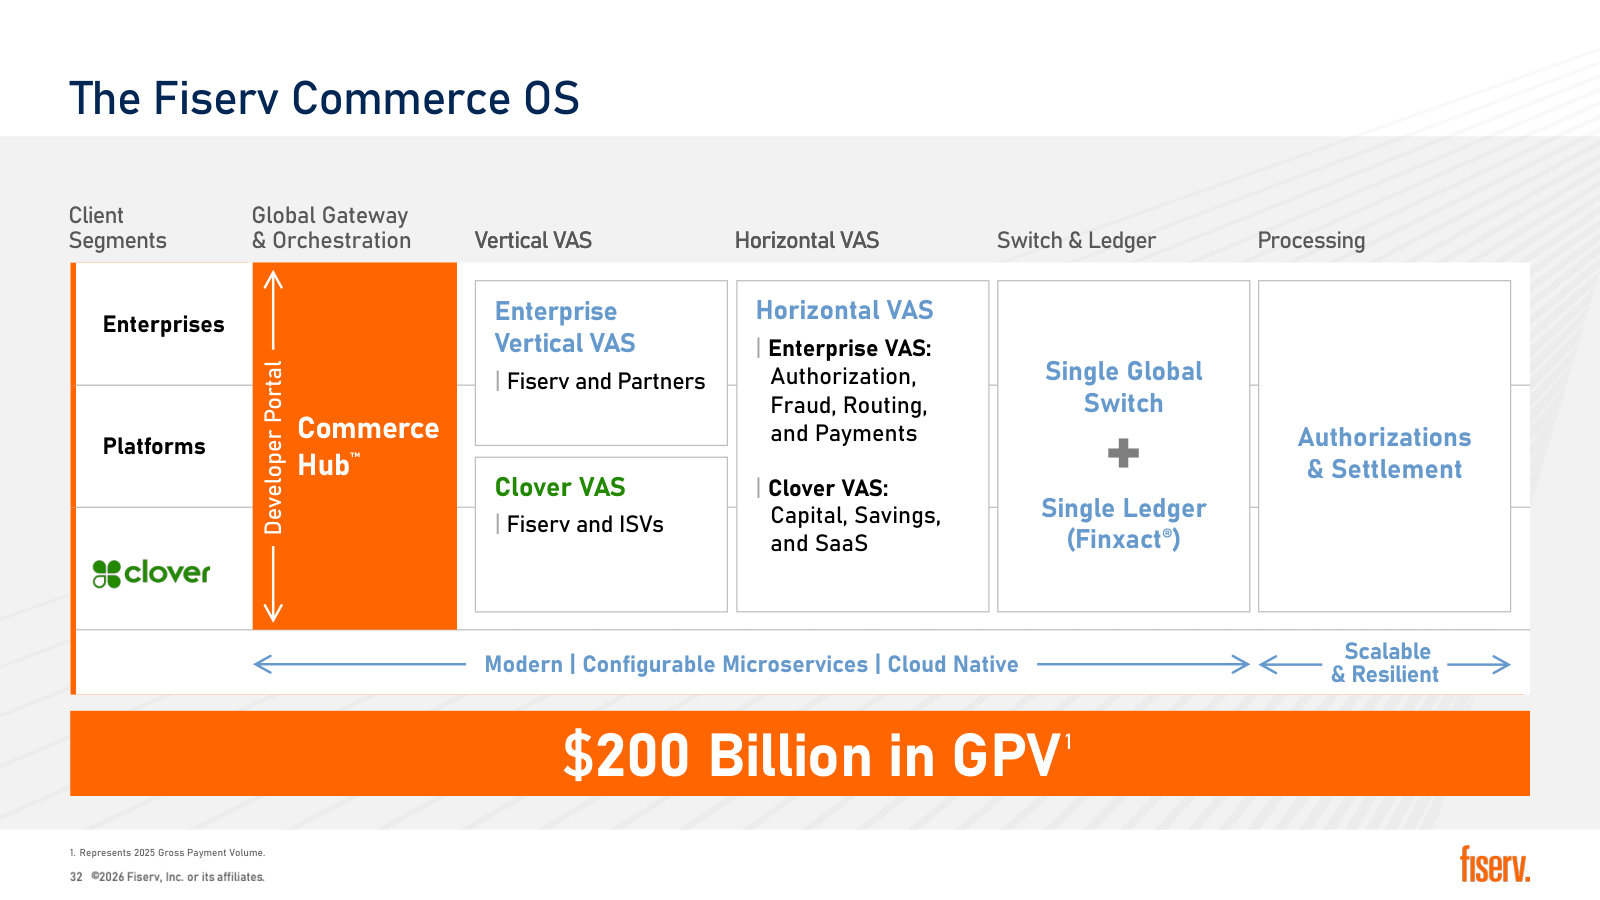
Michael Patrick Lyons (Chief Executive Officer); Robert W. Hau (Chief Financial Officer): We are focused on developing the Clover platform across several key areas to create a comprehensive business operating platform rather than just a point-of-sale payments device. As we advance Clover and enhance our solutions for businesses, we continue to introduce new capabilities each quarter. We are only beginning to explore the potential of Clover, with numerous work streams aimed at elevating the platform. There is considerable excitement about integrating more AI into Clover, such as for inventory optimization, smart menu builders, and better staffing management, all of which enhance service delivery. It's an evolutionary process, and it's crucial to recognize that we are constructing a business operating system. In the United States, we have less than 10% market penetration, and virtually none internationally. Our goal is to help businesses operate more effectively, rather than competing in the point-of-sale software and hardware space. This is our strategic direction, and we find it very promising. Clover is an outstanding platform. […] And Will, just to add to that, overall, we talk about Clover's operating system. It's a payments, it's a software, it's a hardware solution. Your question about hardware being good growth this year, absolutely. Your comment about that will not likely reoccur, I'll generally disagree with. This is a hardware business with software and payments. First of all, we make good margin on our hardware. It is not something we give away. It's not a loss leader. And our hardware, if you look at the hardware revenue as a percent of overall Clover revenue, it's been relatively consistent in kind of the mid-teens range for a few years. We continu to invest in developing new hardware. We think we've got a best-in-class, world-class hardware, and we continue to build out that capability and provide that best-in-class hardware to our client base. So we think that continues to sell into the future.
p. 11 · Read in context →
Q4 and Full Year 2023 Earnings Call — Q4 2023
The pre-reset framework in its original terms — how the two halves of Fiserv are meant to fit together, where the Clover targets came from, and how much of the headline was Argentina. · Open the full transcript →
The company described in two halves, and why the intersection of merchant and financial solutions is the whole argument for owning both.
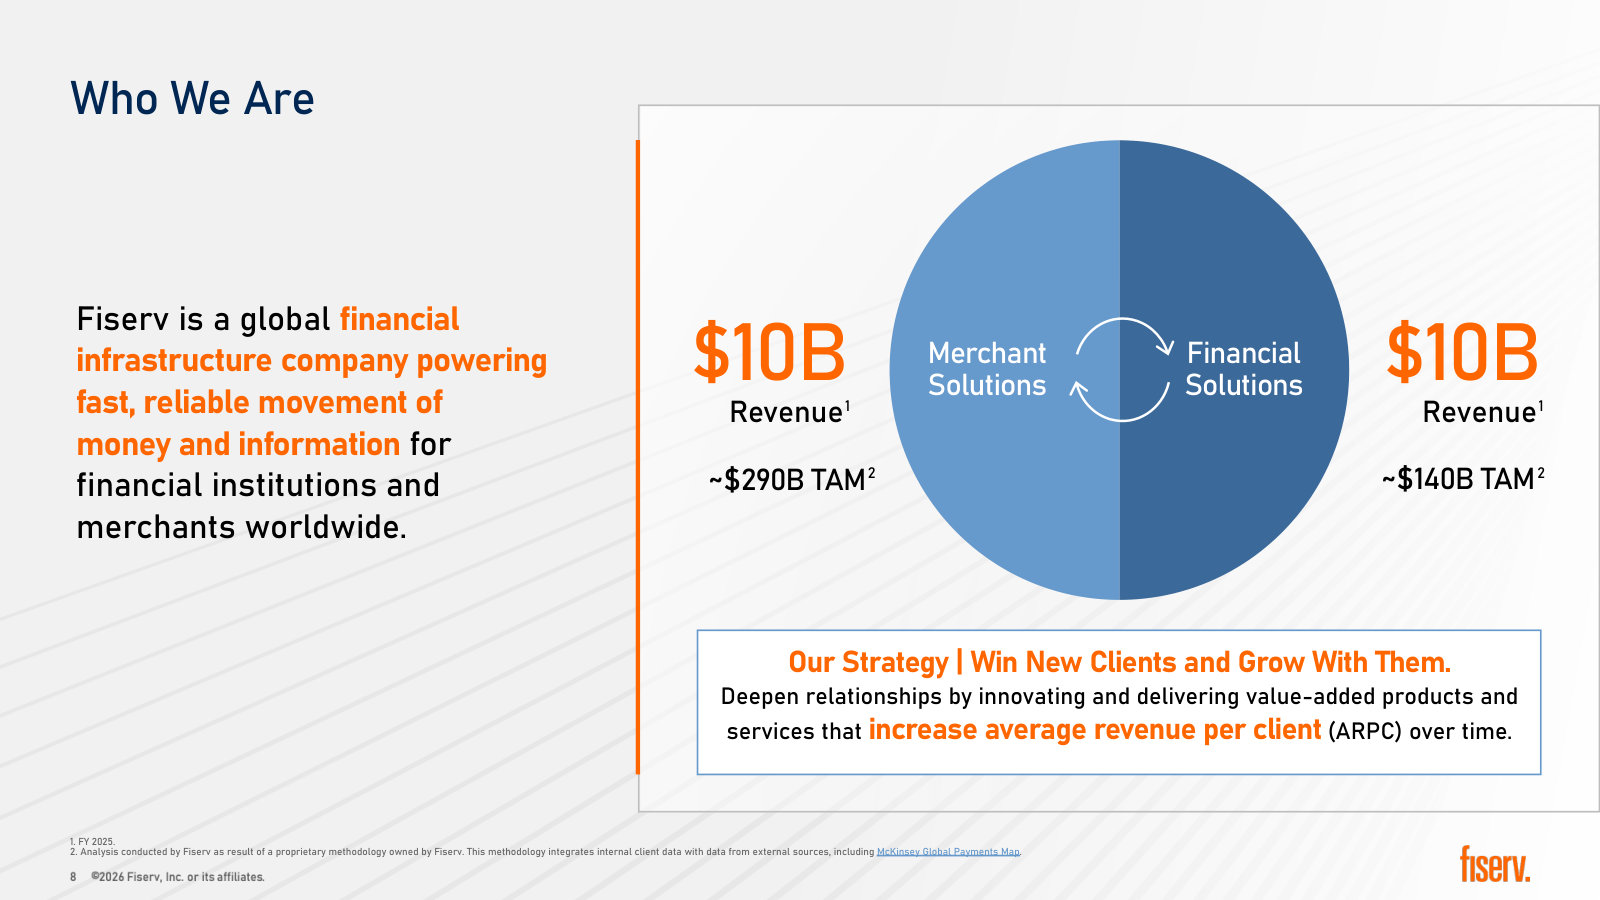
Frank Bisignano (Chairman, President & Chief Executive Officer): Under our new structure, half of our company, Merchant Solutions, is a leader in the high growth payments market where SMBs and enterprises are embracing the benefits of an operating system with seamless integration of value-added solutions. The other half, Financial Solutions, is a leader in the high recurring revenue financial IT software and services market, helping small and medium sized financial institutions level the playing field with larger banks and helping larger banks migrate to next generation technology. This combination of growth and consistency has served us well. And our business model is even more compelling at the intersection of these two businesses. We continue to see strong opportunity to cross-sell and integrate merchant and financial solutions to help financial institutions better serve their merchant customers and enable merchants to retain customers with new financial services offerings. Fisery is unique in its positioning at the center of these two important ecosystems.
p. 1 · Read in context →
The 2024 guide as originally set — 15–17% organic with 7 points of it named up front as Argentine inflation and interest.
Frank Bisignano (Chairman, President & Chief Executive Officer): Turning to the outlook for 2024, we expect total company organic revenue growth of 15% to 17%, inclusive of an estimated 7 points of growth from excess revenue in Argentina, driven by significantly higher inflation and interest in the Argentina merchant business, following the government's steep peso devaluation in mid-December. We expect continued margin improvement in 2024 with at least 100 basis points of adjusted operating margin expansion. And adjusted earnings per share should grow 14% to 16%, reaching $8.55 to $8.70. This adjusted EPS growth outlook is in the middle of the range we provided at our investor conference in November, and it's meant to be a prudent reflection of the macroeconomic outlook.
p. 1 · Read in context →
Merchant mechanics: Argentine inflation offset by peso devaluation in adjusted revenue, with anticipation interest below operating income.
Robert Hau (Chief Financial Officer): Organic revenue growth in the Merchant Acceptance segment was 24% in the quarter and 19% for the full year, well ahead of our previous medium-term segment guidance of 9% to 12%. This includes an 8 point benefit to the full year organic growth from the transitory revenue driven by above-average interest and inflation in Argentina. Adjusted revenue growth was 14% in the quarter and 12% for the full year. You can see from the spread between organic and adjusted revenue growth that currency headwinds from the devaluation of the Argentine peso offset the benefit of the country's very high inflation and interest for the full year in adjusted revenue. Global merchant volume and transactions in the quarter grew 5% and 8%, excluding wholesale processing respectively. Clover revenue grew 30% in the fourth quarter, an annualized payment volume growth of 17%. For the full year, Clover revenue was up 25%. The spread between revenue and volume growth comes from higher penetration of value-added solutions, channel mix shifts and some pricing. VAS penetration reached 19% in Q4, up from 16% in the year-ago period and on pace to meet our 27% target by 2026. […] Over the last couple of quarters, some of you have noted that our revenue includes anticipation in LatAm, but the cost of that anticipation interest is not included in operating margin, as it is reported as interest expense below the operating income line on the income statement. If we were to take that interest from anticipation and pro forma it back to operating income, merchant margins would still have expanded a very strong 220 basis points for the quarter and 260 basis points for the year.
p. 4 · Read in context →
The Argentina walk done in public: the entire 4-point guidance raise is inflation, with adjusted revenue, margin and EPS unchanged.
David Togut (Evercore ISI); Robert Hau (Chief Financial Officer): Thank you. Good morning. Good to see the continued acceleration of Clover growth. I'll ask my question in the follow-up, both upfront. So first is a 4 PPT increase in the organic revenue growth guide for 2024, it looks like about three points of that relate specifically to an increase in Argentina inflation. So if that's correct, could you walk through how your operating organic revenue growth assumptions have changed by segment versus the initial guide at the November Investor Day? […] Yes, David, good morning. And your assessment is right on the mark. The total company organic revenue growth went up from back in November. We said 11% to 13%. We now expect 15% to 17%. We previously indicated the impact, the favorable impact of higher than normal interest and inflation in Argentina, would drive about six points of growth to the Merchant segment, or about three points to the total company. We now expect that excess inflation and interest is about seven points of growth to the total company. So essentially, the increase in organic revenue growth is really attributed to higher inflation and interest out of Argentina. The underlying, more normal organic growth of the Merchant segment and of the company remain consistent with what we expected and saw back in November. The other element, of course, as we talked about in November is, there is a natural counterbalance in our adjusted revenue, and in our income statement that higher excess inflation and interest rate also drives a higher currency variation, or FX headwind. And that also increased about four points from the November. So net, our adjusted revenue, our EPS, our operating margins, very consistent, isolating out just that Argentina impact.
p. 7 · Read in context →
Where the $3.5bn and $4.5bn Clover targets come from, and the caution that 30% growth will not repeat every quarter.
David Togut (Evercore ISI); Robert Hau (Chief Financial Officer); Frank Bisignano (Chairman, President & Chief Executive Officer): Thanks for that. And then just a quick follow-up. What are your expectations for Clover revenue growth in 2024? Would you expect continued acceleration? And then if so, any callouts? I know, Frank, you mentioned Brazil rollout in April? […] Yes. From a Clover standpoint, you saw the acceleration of revenue in the fourth quarter to 30%. We've talked quite a bit about the Clover growth rate, accelerating into our Investor Day commitment. Actually, both back in our March of 2022 call-out where we really focused in on Clover overall, where we gave an outlook to 2025. We updated that back in November to 2026. So adding another year of our outlook, we continue to believe, obviously, that we'll deliver against that $10 billion for the total company and $3.5 billion for Clover in 2025. And then $4.5 billion for Clover in 2026. We feel good about the trajectory. I wouldn't suggest that we're going to get 30% every single quarter, but there's a lot of elements that are driving that growth, and we feel good about the overall trajectory. […] I also would highlight the penetration rate is the number we talked about. We are focused on growing ARPU, and you see that penetration rate up at 19%, which tracks the path we believe we're on. So Clover continues to do its job. The distribution networks we have are unparalleled, and we're bringing more function into it, and more geography into it.
p. 7 · Read in context →
A revenue-model change explained, not excused: banks choosing hosted ASP contracts over licences defers revenue but improves economics.
Darrin Peller (Wolfe Research); Robert Hau (Chief Financial Officer): Guys, thanks. It's great to see the merchant strength. I do want to touch on a couple of the other segments real quickly. On the Fintech side, just to start, I know you expected tough comps, and you obviously called out the software license sales shifting to the ASP side impacting revenues. When we think about what that means in terms of spreading out revenues across a period of time now, in terms of more recurring revenues, maybe just help u understand your anticipation for that segment again. I know you had initially raised the combined Payments and Fintech outlook a little bit when you had your Investor Day. So is that still on track? And if you could just revisit the drivers giving you confidence in both segments. […] Darrin, good morning. When we sign a license deal, typically that's a three or five-year license and you get a large license transaction. December is always a pretty high month for license activity, and you get ongoing maintenance, but license is certainly the big chunk. When a client instead goes to an ASP contract, you book that over the multi-year period monthly. We feel good; ultimately that's actually a better economic transaction for us, so we like that transition.
p. 9 · Read in context →
Why a payments company applied for a bank charter — sponsorship of its own merchant acquiring, and what that does not mean.
Jason Kupferberg (Bank of America); Frank Bisignano (Chairman, President & Chief Executive Officer): Okay. Good color. Just on a separate note, we saw last month Fiserv applied for a bank charter in Georgia. Can you talk about the steps, potential timeline to get that application approved, what the benefit to Fiserv would potentially be, whether that's on the cost side or ability to provide additional solutions to merchants? Thanks. […] Let me bring clarity to that. There's lots of questions about why Fiserv is applying for a bank license. Before we did that, we talked to the ABA and communicated to our clients. It's a very specific purpose license that allows for sponsorship of merchant acquiring.
Historically you needed a bank for that within Visa and Mastercard rules. Our ability to have an institution for that sole purpose that will allow us to be a sponsor for our own merchant acquiring in certain instances will be valuable because we can control more of the outcome than we could before. This is very specific and we are not competing with our bank partners. We have great bank partners and a large bank portfolio. This ultimately supports smaller banks who do not have sponsorship and we can bring it to them. It became clearer in the merger when we were able to cross-sell to our community banks, and having the capability ourselves will be valuable.
p. 11 · Read in context →
More calls
Q1 2025 Earnings Call — Q1 2025 · 14 pages · The handover call: Bisignano's last, Lyons' first, with the 10–12% organic and 15–17% EPS guidance still fully intact — the baseline the October reset was measured against. · Open →
Q4 and Full Year 2024 Earnings Call — Q4 2024 · 11 pages · Where the 2025 plan was set — 10–12% organic, 125bp of margin expansion, a fortieth straight year of double-digit EPS — with 2024 growth restated ex-Argentina at 11%. · Open →
Q3 2024 Earnings Call — Q3 2024 · 11 pages · The DoorDash embedded-finance win explained end to end, and the last guidance raise of the old era (organic to 16–17%). · Open →
Q2 2024 Earnings Call — Q2 2024 · 12 pages · The CashFlow Central build-out at its most detailed, and the value-added-services penetration path holding at 20% without the usual seasonal dip. · Open →
Q1 2024 Earnings Call — Q1 2024 · 10 pages · The five drivers management said would deliver the November 2023 Investor Day targets, including the $12 billion 2026 merchant revenue goal. · Open →
Q3 2023 Earnings Call — Q3 2023 · 11 pages · The last call before the November 2023 investor conference that set the medium-term targets, with 2023 organic growth raised to the top of its range. · Open →
Q4 and Full Year 2021 Earnings Call — Q4 2021 · 32 pages · The First Data integration era in the old segment language — useful for the pre-2023 base rates, though the page text is a third-party web capture with heavy page furniture. · Open →
Fiserv, Inc.'s annual reports contain management's most considered account of the business. These are the sections, passages and visual pages worth opening in the originals preserved in Sources.
Fiserv, Inc. — FY2025 Annual Report (Form 10-K) — FY2025
The first 10-K after the 2025 reset: it defines the One Fiserv action plan and discloses how thin the goodwill cushion has become. · Open the full document →
Item 1. Business — Overview — p. 5 · Read the full section →
Sets scale and revenue character in one place: $21.2 billion of revenue, 80% of it recurring processing fees on multi-year contracts.
Management's own framing of scale, recurring revenue and the non-discretionary nature of the services.
Fiserv, Inc. is a leading global provider of payments and financial services technology solutions. We are publicly traded on the NASDAQ Global Select Market and part of the S&P 500 Index. […] Most of the products and services we provide are necessary for our clients to operate their businesses and are therefore non-discretionary in nature. […] In 2025, we had $21.2 billion in total revenue, $5.8 billion in operating income and $6.1 billion of net cash provided by operating activities. Processing and services revenue, which in 2025 represented 80% of our total revenue, is primarily generated from account and transaction-based fees under multi-year contracts that generally have high renewal rates.
p. 5 · Read in context →
Merchant Solutions — p. 5 · Read the full section →
The larger segment by revenue, and the one whose growth rests on Clover and on a distribution chain the company does not fully own.
What the Merchant segment sells, and the partner channels it depends on to sell it.
The businesses in our Merchant segment provide commerce-enabling products and services to companies of all sizes around the world. […] We distribute the products and services in the Merchant segment businesses through a variety of channels, including direct sales teams, strategic partnerships with agent sales forces, ISVs, independent sales organizations (“ISOs”), financial institutions and other strategic partners in the form of joint venture alliances, revenue sharing alliances and referral agreements.
p. 5 · Read in context →
Where Clover is being pushed next — verticals beyond restaurant and retail.
We offer merchant acquiring solutions to enable small businesses to securely accept payment transactions online or in-person. […] We are growing Clover through new and expanded partnerships, industries and geographies. Our focus remains on high-growth industry verticals such as healthcare, e-commerce, and professional services, while maintaining a strong presence in restaurant and retail.
p. 7 · Read in context →
Financial Solutions — p. 8 · Read the full section →
The higher-margin segment: core account processing and debit networks, plus the newer embedded-finance and stablecoin work.
The Financial segment's client base and the debit-processing services at its core.
The businesses in our Financial segment provide products and services to financial institutions, corporate and public sector clients across the world, enabling the processing of customer loan and deposit accounts, digital payments and card transactions. […] We provide debit card processing services, which include tokenization, loyalty and reward programs; customized authorization processing; gateway processing to payment networks; ATM managed services and cash and logistics management; and risk management products.
p. 8 · Read in context →
How Finxact, Payfare and Commerce Hub are assembled into the embedded-finance stack, and where FIUSD sits.
We have developed a comprehensive end-to-end embedded finance solution that supports various payment flows. This solution is built on a sophisticated ledger powered by Finxact to record transactions between buyers and sellers; an orchestration layer powered by Payfare to manage each transaction; and payment acceptance powered by Commerce Hub. Together, these components support all payment flows for payouts, returns, and reconciliations. […] We are building our stablecoin capabilities with the launch of FIUSD, embedded within our existing banking and payments ecosystem, which allows customers access to more efficient and interoperable digital asset service.
p. 10 · Read in context →
Our Strategy — p. 12 · Read the full section →
The strategy section rewritten around One Fiserv — worth reading against the FY2023 version below to see how much the framing changed.
The strategic framing that replaced the prior 'move money and information' aspiration.
We are committed to delivering exceptional client service, world-class execution, and innovative value-added solutions. Our leading payment platforms and robust portfolio of value-added technology solutions position us at the intersection of finance and commerce. […] We have strong conviction in our assets, talent, strategy and our ability to execute and innovate. Consistent with this focus, we launched our One Fiserv action plan and are operating our business under the following strategic framework:
p. 12 · Read in context →
Item 1A. Risk Factors — Competitive and Business Risks — p. 21 · Read the full section →
Two company-specific risks: whether the One Fiserv plan delivers, and the alliance structure that lost the Wells Fargo joint venture.
The five One Fiserv pillars, followed by management's own list of what could keep them from paying off.
In 2025, we announced a strategic plan, referred to as the One Fiserv action plan, that focuses on: operating with a client-first mindset to win new enterprise clients and grow average revenue per client; building the pre-eminent small business operating platform throug Clover; creating differentiated, innovative platforms in finance and commerce, including embedded finance and stablecoin; delivering operational excellence enabled by artificial intelligence; and employing disciplined capital allocation for the long-term. To successfully execute the plan, we must implement operational, technological and cultural changes across our organization, which may be difficult to do. […] As a result, the actual benefits of the plan may be less significant than anticipated. Furthermore, we may not be able to achieve expected benefits of the plan on our anticipated timeline or at all.
p. 23 · Read in context →
The alliance model explained, and the admission that these fixed-term arrangements may not renew.
Under our alliance program, a bank or other institution forms an alliance with us, generally on an exclusive basis, either contractually or through a separate legal entity. […] Our merchant acquiring business depends, in part, on our merchant relationships, alliances and other distribution channels. There can be no guarantee that we will achieve growth in our merchant relationships, alliances or other distribution channels. In addition, our contractual arrangements with merchants and merchant alliance partners are for fixed terms and may allow for early termination upon the occurrence of certain events. There can be no assurance that we will be able to renew our contractual arrangements with these merchants or merchant alliance partners on similar terms or at all.
p. 24 · Read in context →
Item 1A. Risk Factors — Organizational and Financial Risks — p. 34 · Read the full section →
The balance-sheet pair that sizes the downside: goodwill and intangibles at roughly 60% of assets, against about $29 billion of debt.
The stated debt load and the specific flexibilities management says it costs.
At December 31, 2025, we had approximately $29 billion of debt. We and our subsidiaries may incur additional indebtedness in the future. Our indebtedness could: decrease our ability to obtain additional financing for working capital, capital expenditures, general corporate or other purposes; limit our flexibility to make acquisitions; increase our cash requirements to support the payment of interest; limit our flexibility in planning for, or reacting to, changes in our business and our industry; limit our ability to return capital to shareholders, including through share repurchases; and increase our vulnerability to adverse changes in general economic and industry conditions.
p. 36 · Read in context →
Item 7. MD&A — One Fiserv Action Plan — p. 49 · Read the full section →
Management's fullest description of the transformation launched in Q3 2025, including the AI and process work behind it.
What the plan actually asks the organization to do, in management's words.
In the third quarter of 2025, we launched the One Fiserv action plan designed to prioritize and enhance client focus across five strategic pillars. […] To advance this transformation, we are simplifying and standardizing processes, adopting new ways of working, and embedding AI to create a higher-quality, more productive business. This approach rethinks how business functions operate and aligns our product portfolio for the future. We are modernizing our technology infrastructure, enhancing resiliency, and reengineering our operating mode through AI and advanced automation.
p. 49 · Read in context →
Critical Accounting Policies and Estimates — Goodwill and Intangible Assets — p. 53 · Read the full section →
Ties the share-price decline to the balance sheet: a Q4 triggering event, no impairment, and eight reporting units under a 15% cushion.
A fourth-quarter triggering event from the stock-price decline forced a second goodwill test; $37.7 billion survived it.
As of October 1, 2025, we performed our annual goodwill impairment assessment and determined that the estimated fair values exceeded the respective carrying values for each of our reporting units. Subsequently, we determined that a triggering event occurred in the fourth quarter of 2025 due to a sustained decline in our stock price and, therefore, performed an additional goodwill impairment test as of December 31, 2025. The impairment assessment performed at December 31, 2025 determined that our goodwill of $37.7 billion was not impaired as the estimated fair values exceeded the respective carrying values for each of our reporting units. At December 31, 2025, fair values exceeded carrying values by less than 15% for eight of our reporting units with an aggregate goodwill balance of $18.5 billion as follows:
p. 55 · Read in context →
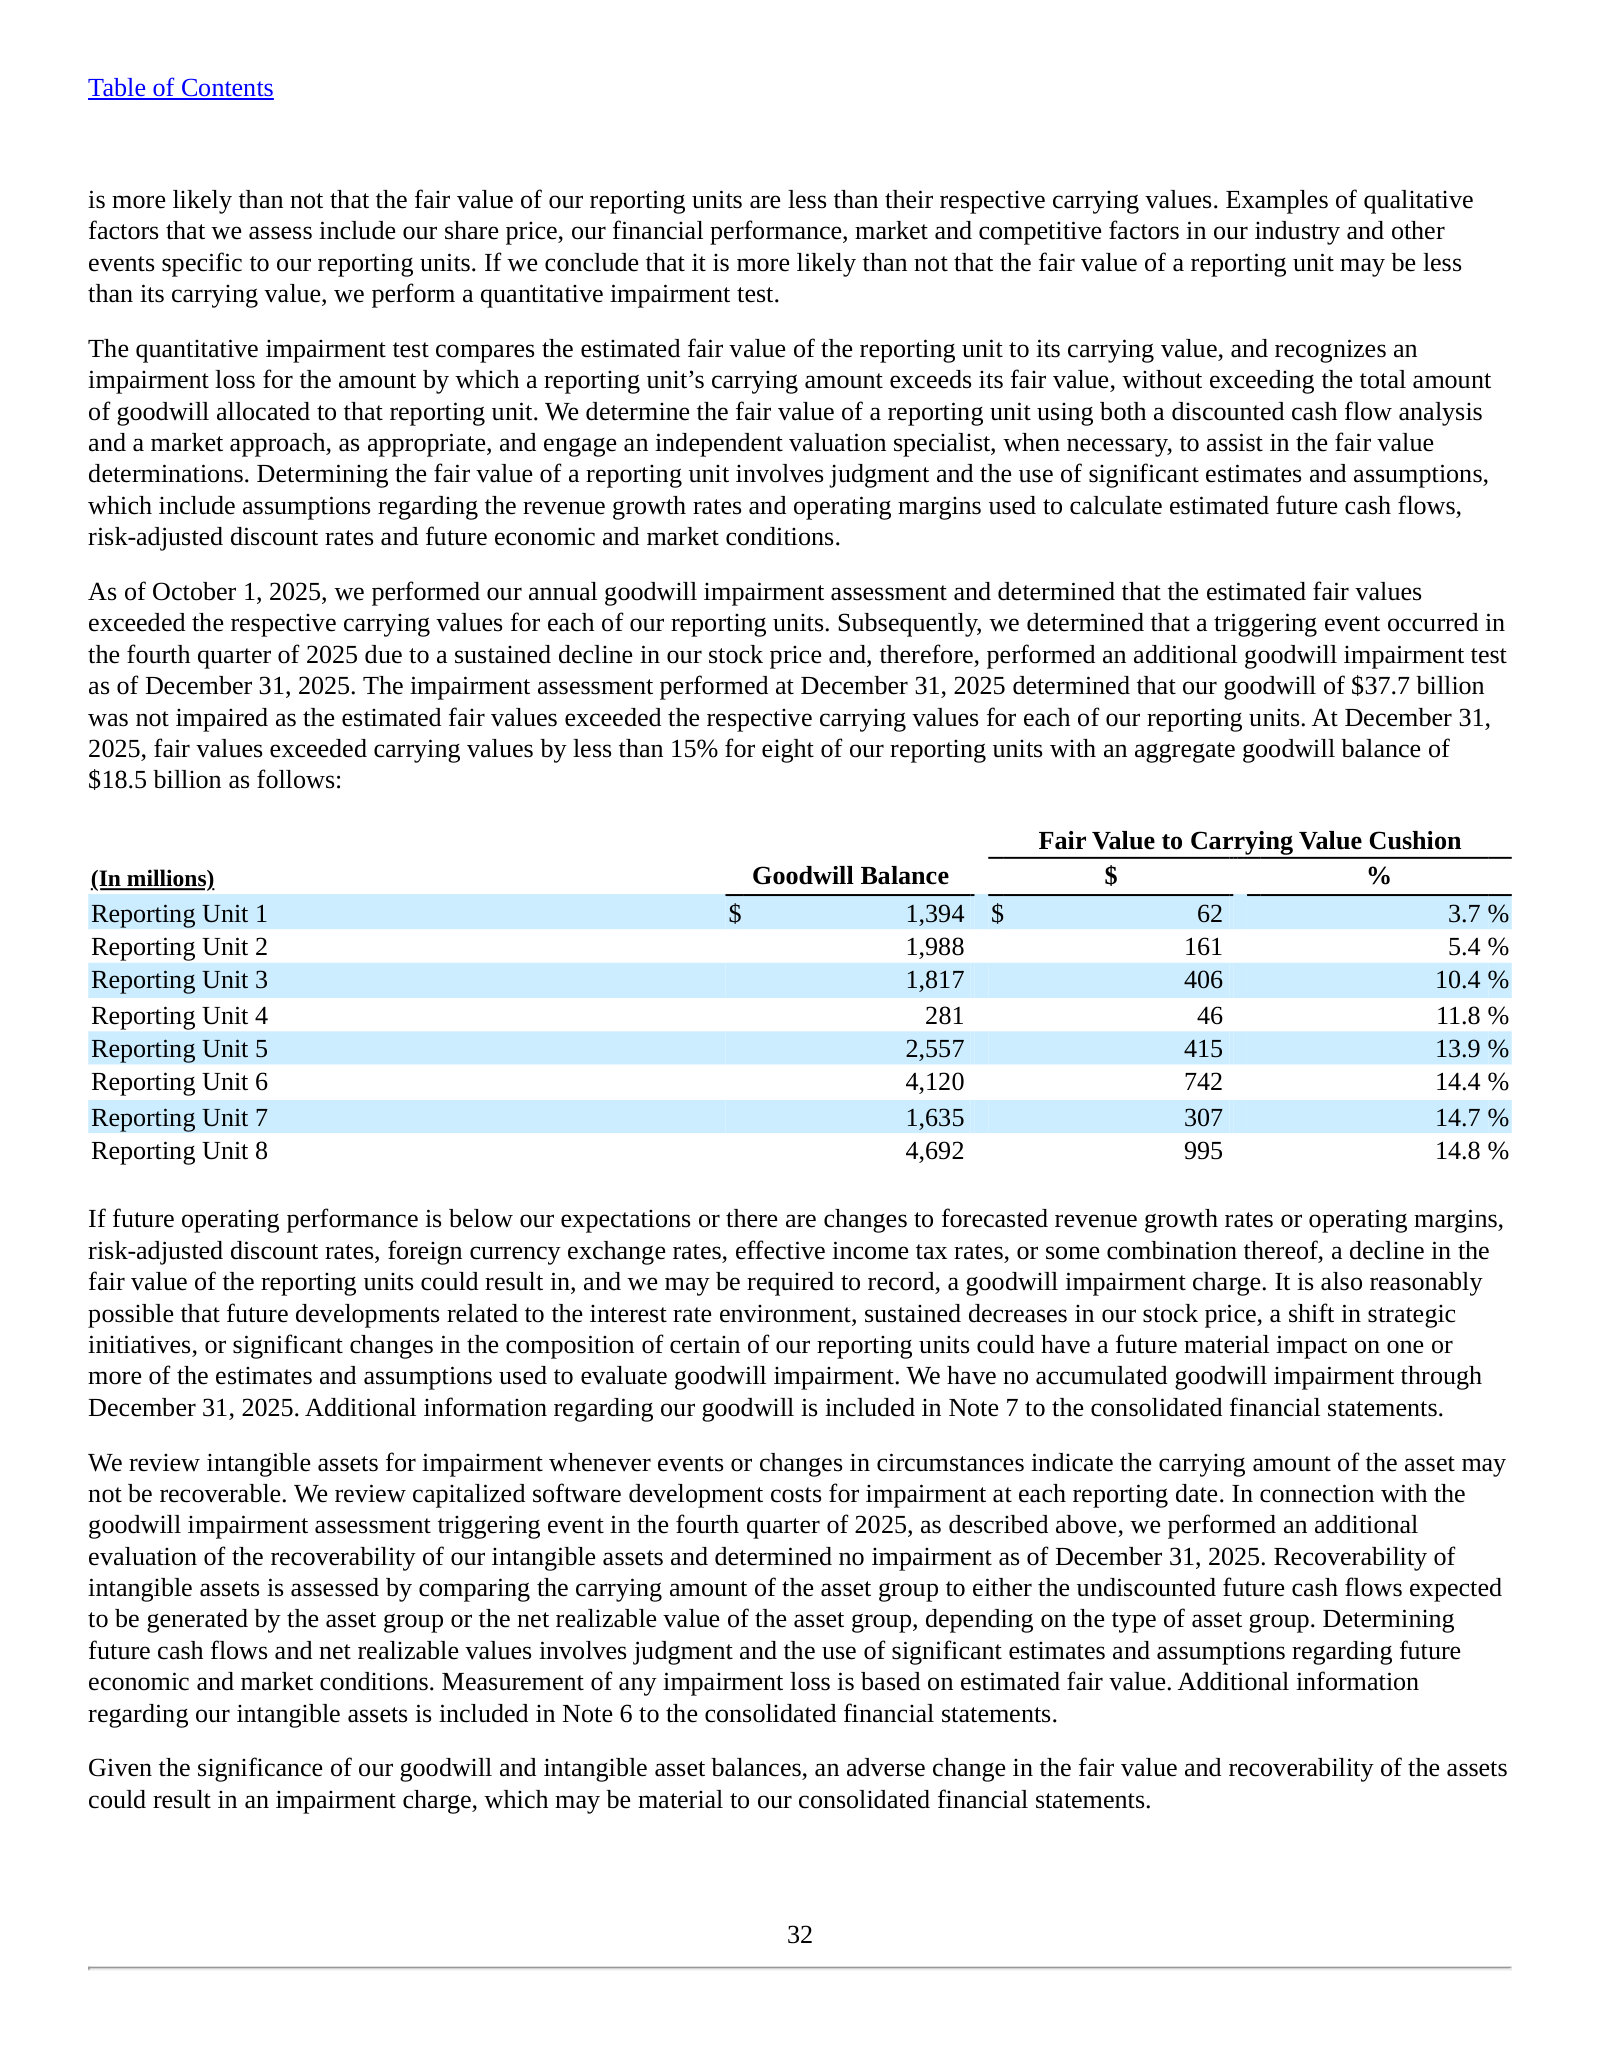
Item 7. MD&A — Results of Operations — p. 59 · Read the full section →
Where the year is explained: 4% revenue growth alongside margin decline in both segments, with the drivers named line by line.
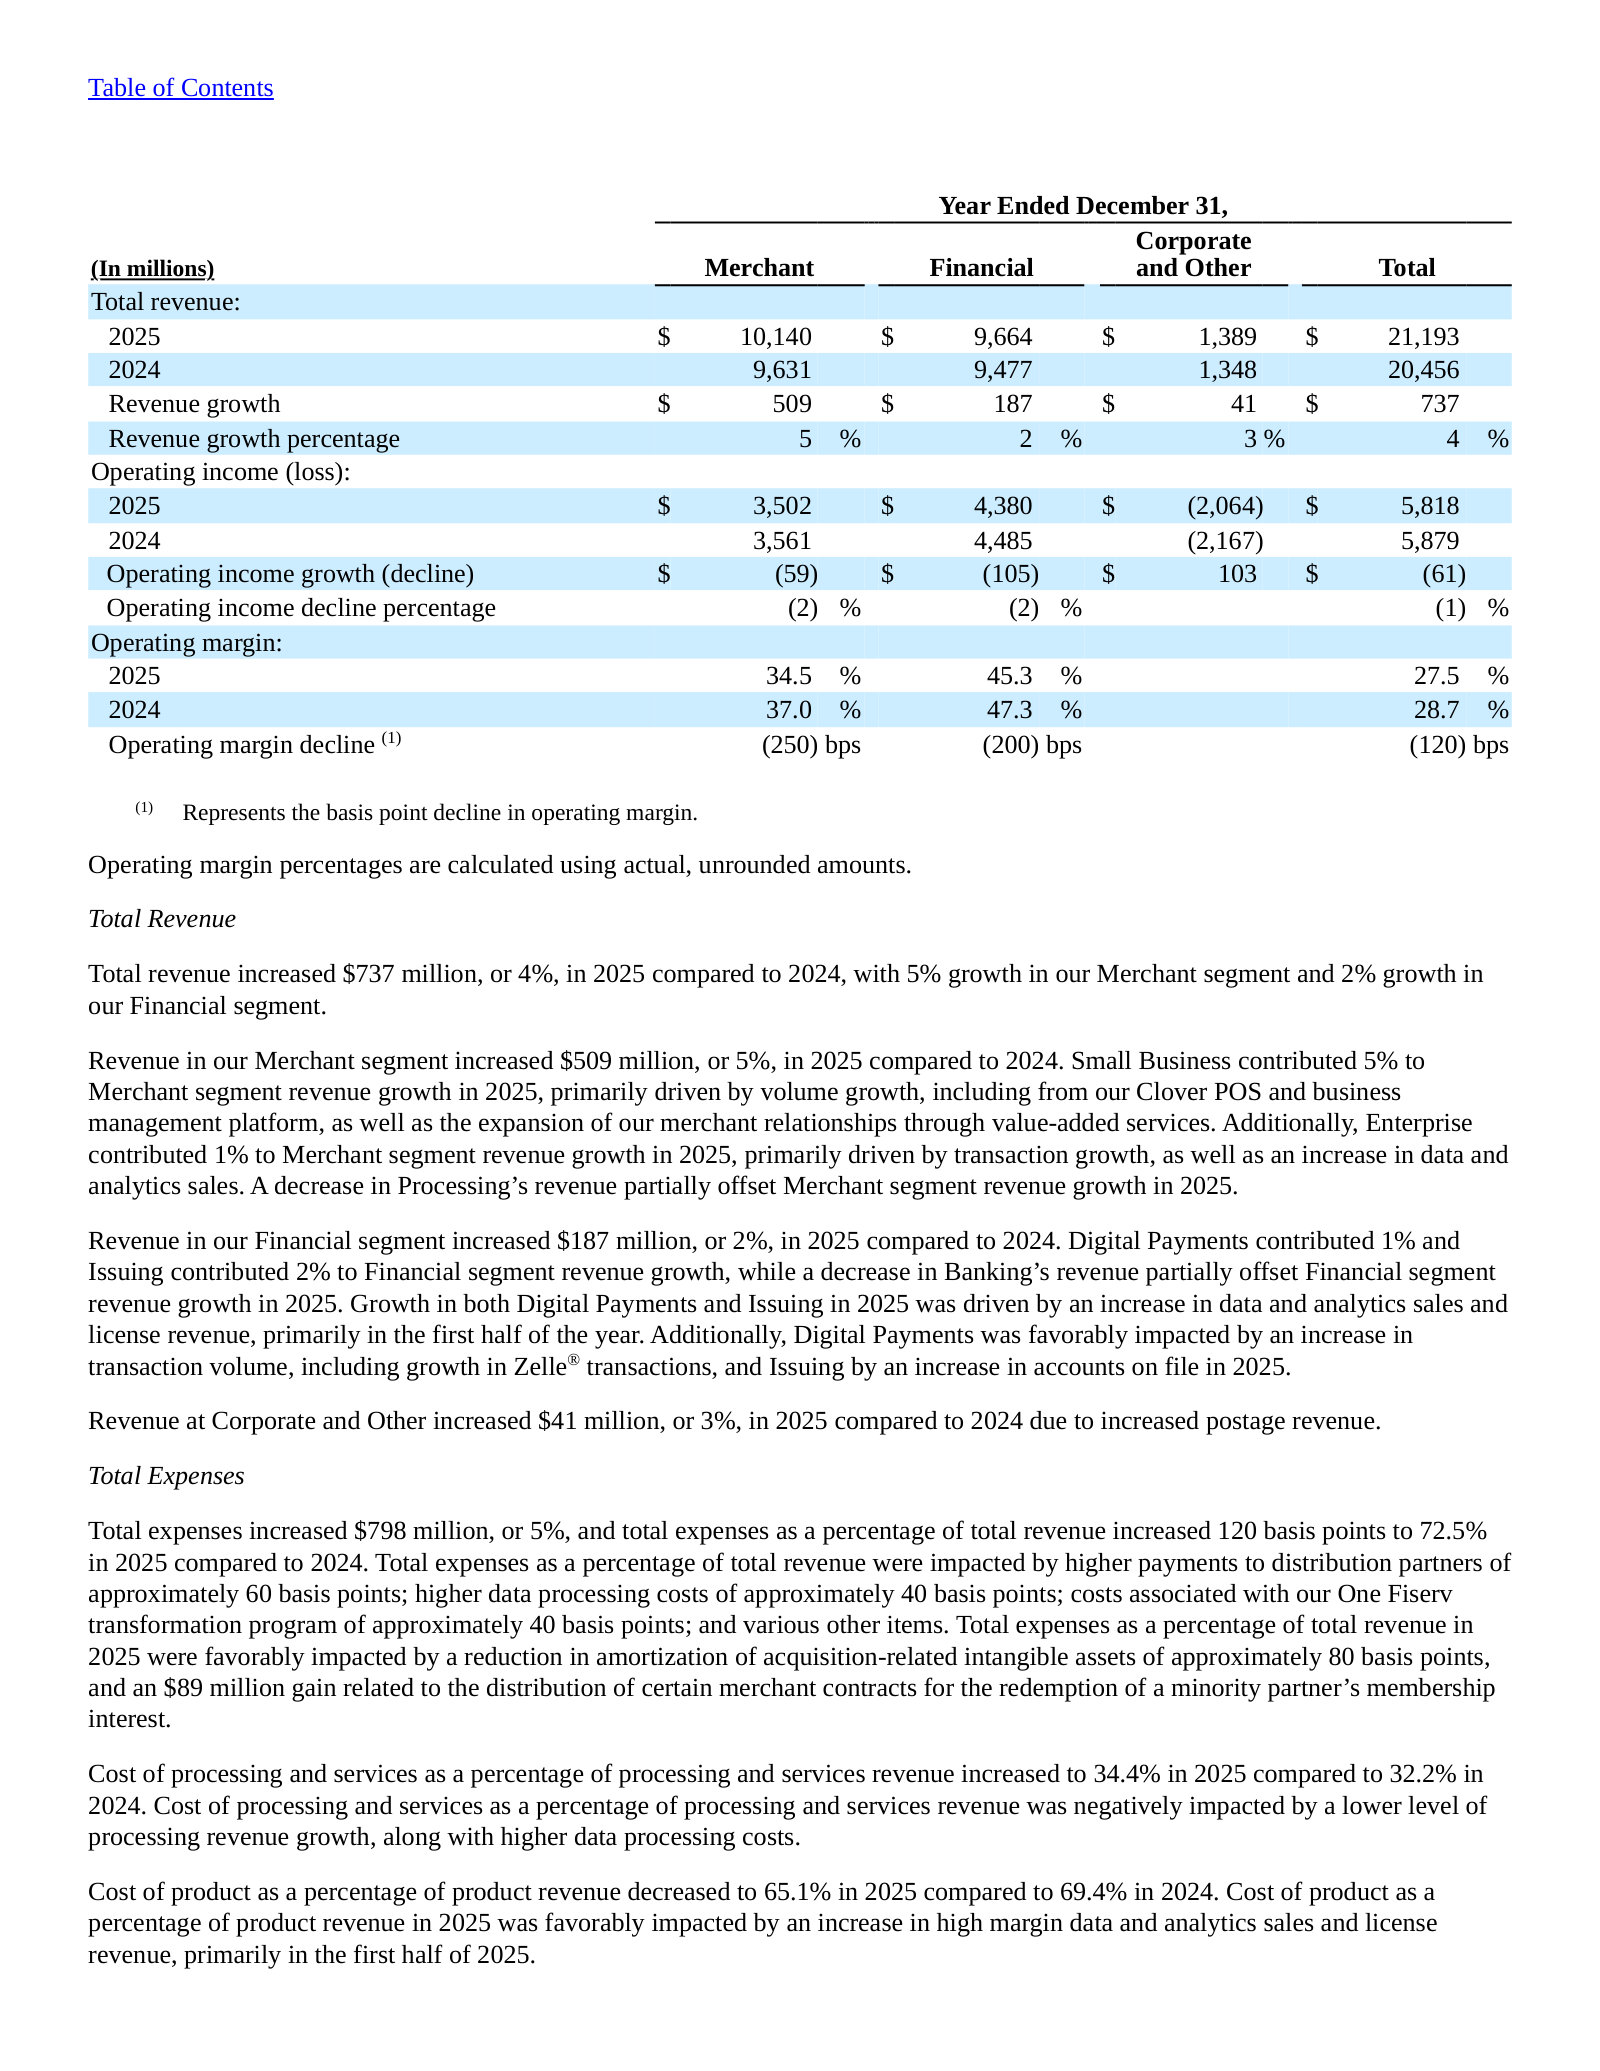
Fiserv, Inc. — FY2023 Annual Report (Form 10-K) — FY2023
The last 10-K under the three-segment structure, and the one announcing the realignment into today's Merchant and Financial segments. · Open the full document →
Item 1. Business — Overview — p. 6 · Read the full section →
The 'before' picture: $19.1 billion of revenue reported across Acceptance, Fintech and Payments — three segments that no longer exist.
Scale and the three-segment structure as reported for 2023.
In 2023, we had $19.1 billion in total revenue, $5.0 billion in operating income and $5.2 billion of net cash provided by operating activities. Processing and services revenue, which in 2023 represented 82% of our total revenue, is primarily generated from account and transaction-based fees under multi-year contracts that generally have high renewal rates. […] Our operations are comprised of the Merchant Acceptance (“Acceptance”) segment, the Financial Technology (“Fintech”) segment and the Payments and Network (“Payments”) segment.
p. 6 · Read in context →
More annual reports
Fiserv, Inc. — FY2024 Annual Report (Form 10-K) — FY2024 · 172 pages · First year reported on the two-segment basis, and the pre-reset baseline: 28.7% operating margin against 27.5% in 2025. · Open →
Fiserv, Inc. — FY2022 Annual Report (Form 10-K) — FY2022 · 168 pages · The Acceptance/Fintech/Payments structure at full stretch, with Clover and Carat described as separate operating systems. · Open →
Fiserv, Inc. — FY2021 Annual Report (Form 10-K) — FY2021 · 181 pages · The earliest edition on file, useful as the post-First Data integration starting point for the revenue and margin series. · Open →
Source: S&P Capital IQ consensus via Xpressfeed · Generated 2026-07-31.
Consensus puts FY26 normalized EPS at $8.12, about 6% below the $8.64 actually earned in FY25, with revenue growth troughing near 1%. The tape has been resetting since the September-2025 quarter, when revenue landed 8.0% below consensus and normalized EPS 22.9% below — the only real break in a record where revenue has missed in all eight quarters captured. FY27 estimates have drifted down about 2% over six months while FY28 has firmed. The recovery the street models, $11.62 of normalized EPS by FY29, rests on five estimates.
FY26 is a down year: EPS consensus sits 6% below FY25's actual before a modeled climb to $11.62 by FY29
Revenue growth troughs near 1% in FY26 and settles around 4% thereafter, while normalized EPS falls first and then compounds faster than revenue. Consensus EBITDA does not regain its FY25 level until FY28, and gross margin bottoms at 59.3% in FY26 before working back to 61.5% by FY29. The shape is a reset year followed by a modeled margin recovery, with the FY29 column resting on a handful of estimates.
Currency: USD · Scale: money in millions, absolute · YoY uses the prior fiscal year from the feed; analyst count and range use the first displayed period.
| Metric | FY2025A | FY2026E | FY2027E | FY2028E | FY2029E | YoY | Analysts | Low / high |
|---|---|---|---|---|---|---|---|---|
| Revenue | $19.81bn | $20.04bn | $20.85bn | $21.63bn | $22.55bn | — | 27 | $19.71bn / $19.89bn |
| EPS (normalized) | $8.56 | $8.12 | $8.93 | $10.02 | $11.62 | — | 36 | $8.49 / $8.65 |
| EBITDA | $9.21bn | $8.67bn | $8.99bn | $9.34bn | $9.38bn | — | 20 | $8.80bn / $9.53bn |
| Gross margin | 61.2% | 59.3% | 60.1% | 60.8% | 61.5% | — | — | — |
| Free cash flow | $4.31bn | $3.88bn | $4.28bn | $4.68bn | $4.15bn | — | — | — |
Revenue has missed consensus in all eight quarters on record; normalized EPS beat in seven of eight
Current sequences by metric: Revenue: 8 consecutive misses; EPS (normalized): 2 consecutive beats.
Currency: USD · Scale: money in millions, absolute · Consensus is captured before each actual first became effective.
| Quarter | Metric | Consensus | Actual | Surprise | Outcome |
|---|---|---|---|---|---|
| Q1 FY2026 | Revenue | $4.73bn | $4.67bn | -1.1% | Miss |
| Q1 FY2026 | EPS (normalized) | $1.58 | $1.79 | +13.5% | Beat |
| Q4 FY2025 | Revenue | $4.90bn | $4.90bn | -0.1% | Miss |
| Q4 FY2025 | EPS (normalized) | $1.90 | $1.99 | +4.6% | Beat |
| Q3 FY2025 | Revenue | $5.35bn | $4.92bn | -8.0% | Miss |
| Q3 FY2025 | EPS (normalized) | $2.65 | $2.04 | -22.9% | Miss |
| Q2 FY2025 | Revenue | $5.20bn | $5.20bn | -0.1% | Miss |
| Q2 FY2025 | EPS (normalized) | $2.43 | $2.47 | +1.5% | Beat |
| Q1 FY2025 | Revenue | $4.84bn | $4.79bn | -1.0% | Miss |
| Q1 FY2025 | EPS (normalized) | $2.07 | $2.14 | +3.2% | Beat |
| Q4 FY2024 | Revenue | $4.96bn | $4.90bn | -1.1% | Miss |
| Q4 FY2024 | EPS (normalized) | $2.48 | $2.51 | +1.2% | Beat |
| Q3 FY2024 | Revenue | $4.91bn | $4.88bn | -0.4% | Miss |
| Q3 FY2024 | EPS (normalized) | $2.26 | $2.30 | +1.6% | Beat |
| Q2 FY2024 | Revenue | $4.81bn | $4.79bn | -0.3% | Miss |
| Q2 FY2024 | EPS (normalized) | $2.10 | $2.13 | +1.4% | Beat |
FY27 EPS estimates have slipped 2.3% in six months while FY28 has firmed 2.8%
Revenue estimates for both years have moved less than 1% in either direction over 180 days, so what revision there is sits in the earnings line, not the top line. The FY27 drift is steady rather than abrupt: down 0.1% over 30 days, 0.9% over 90, 2.3% over 180.
Currency: USD · Scale: money in millions, absolute · Point-in-time consensus; Δ90d is Now versus 90d.
| Metric | FY | 180d | 90d | 30d | Now | Δ90d |
|---|---|---|---|---|---|---|
| EPS (normalized) | FY2027 | $9.15 | $9.02 | $8.95 | $8.93 | -0.9% |
| EPS (normalized) | FY2028 | $9.75 | $10.00 | $10.06 | $10.02 | +0.2% |
| Revenue | FY2027 | $20.98bn | $20.92bn | $20.86bn | $20.85bn | -0.3% |
| Revenue | FY2028 | $21.74bn | $21.79bn | $21.64bn | $21.63bn | -0.7% |
Normalized EPS is tightly held; GAAP earnings are where the street actually disagrees
FY26 normalized EPS clusters closely across 37 estimates, yet GAAP net income for the same year is proportionally the widest row in the near-term tape on 22 estimates. Outer-year rows widen further as coverage thins, so treat the FY28 normalized EPS range as a thinner-panel spread rather than a sharper debate.
Currency: USD · Scale: money in millions, absolute · Spread/mean is absolute high-low divided by absolute mean.
| Metric | Period | Mean | Low–high | Spread/mean | Analysts |
|---|---|---|---|---|---|
| EPS (normalized) | FY2026E | $8.12 | $7.69–$8.29 | 7.4% | 37 |
| Net income (GAAP) | FY2026E | $3.00bn | $2.38bn–$3.48bn | 36.6% | 22 |
| EPS (GAAP) | FY2027E | $6.60 | $5.38–$7.41 | 30.8% | 18 |
| EPS (normalized) | FY2028E | $10.02 | $8.62–$11.18 | 25.5% | 20 |
| Revenue | FY2028E | $21.63bn | $20.16bn–$22.16bn | 9.2% | 15 |
25 analysts sit at hold, and price targets span $40 to $115
The consensus recommendation score is 2.67, and the mean target of $66.63 sits above the median of $63, so a small group of high targets pulls the average up. The $40 low and $115 high are a measure of disagreement, not of value: this feed carries no current share price.
Currency: USD · Scale: money in millions, absolute · Analyst counts shown explicitly.
| Street view | Reading | Analysts |
|---|---|---|
| Recommendation mix | Buy 6, Outperform 3, Hold 25, Underperform 1, Sell 1 | 36 |
| Consensus score | 2.67 | 36 |
| Target price | mean $66.63; median $63.00; high $115.0; low $40.00 | 27 |
Coverage thins fast: FY29 rests on 5 EPS estimates and a two-analyst EBITDA
FY26 and FY27 each carry 37 normalized EPS estimates; FY28 drops to 20 and FY29 to 5, with FY29 revenue on 4 and FY29 EBITDA a two-analyst mean. Read the outer-year climb as the view of a few early modellers, not a settled consensus.
Visible Alpha broker models via S&P Xpressfeed · 25 brokers · 428 line items · freshest revision 2026-07-24.
Broker models treat FY-2026 as Fiserv's reset year and FY-2027 as the recovery: total organic growth troughs at 1.2% before returning to 4.1%, and operating margin falls from 37.4% to 33.6% before clawing back only part of it. The turn is not gradual — the median model has organic growth going from -2.9% in 2QFY-2026 to +5.0% in 3QFY-2026, so the thesis gets tested almost immediately. Clover is what the models are paying for; Financial Solutions is what they are waiting on. The disagreement that matters is not on EPS, where 24 brokers sit in a narrow band, but on the segment profit pool and the pace of the buyback.
Organic growth swings from -2.9% in 2QFY-2026 to +5.0% in 3QFY-2026 — the models front-load the recovery
The turn is modeled as broad rather than concentrated: Banking, Issuing and Merchant processing all sit negative in 2QFY-2026 and all are positive by 3QFY-2026. Nothing in the reported quarters yet supports it, so this is the single assumption most exposed to the next print.
| Line | 3QFY-2025A | 4QFY-2025A | 1QFY-2026A | 2QFY-2026A | 3QFY-2026E | 4QFY-2026E | 1QFY-2027E | 2QFY-2027E | Brokers |
|---|---|---|---|---|---|---|---|---|---|
| Total | — | — | — | — | — | — | — | — | — |
| Organic revenue - Growth rate - Operating(%) | 9.3% | -0.4% | -1.9% | -2.9% | 4.9% | 6.1% | 4.5% | 4.6% | 18 |
| Merchant solutions | — | — | — | — | — | — | — | — | — |
| Organic revenue - Growth rate - Merchant solutions - Operating(%) | 12.5% | 1.9% | 1.7% | 1.0% | 5.7% | 7.4% | 5.6% | 5.5% | 19 |
| Organic revenue - Growth rate - Merchant solutions - Small business - Operating(%) | 13.6% | 1.0% | 1.9% | 1.4% | 6.0% | 7.9% | 6.8% | 6.5% | 14 |
| Organic revenue - Growth rate - Merchant solutions - Processing - Operating(%) | 4.1% | -6.3% | -1.5% | -7.1% | 1.7% | 2.4% | 1.6% | 1.2% | 14 |
| Financial solutions | — | — | — | — | — | — | — | — | — |
| Organic revenue - Growth rate - Financial solutions - Operating(%) | 6.0% | -2.3% | -5.2% | -6.5% | 3.8% | 4.3% | 3.3% | 3.3% | 20 |
| Organic revenue - Growth rate - Financial solutions - Banking - Operating(%) | 0.9% | -4.3% | -5.3% | -5.9% | 1.4% | 2.1% | 2.2% | 2.1% | 13 |
| Organic revenue - Growth rate - Financial solutions - Issuing - Operating(%) | 8.7% | 1.7% | -4.4% | -8.9% | 3.9% | 4.7% | 3.8% | 3.8% | 12 |
Key drivers
| Line | FY-2025A | FY-2026E | FY-2027E | FY-2028E | YoY | Brokers |
|---|---|---|---|---|---|---|
| Segment revenue | — | — | — | — | — | — |
| Revenue - Merchant solutions - Operating | $10.16bn | $10.47bn | $11.00bn | $11.52bn | +3.0% | 23 |
| Revenue - Financial solutions - Operating | $9.65bn | $9.58bn | $9.86bn | $10.16bn | -0.7% | 24 |
| Clover | — | — | — | — | — | — |
| GPV - Clover($B) | $327.23bn | $358.13bn | $394.20bn | $430.18bn | +9.4% | 11 |
| Take rate - Clover(%) | 1.0% | 1.0% | 1.0% | 1.1% | +0.0pt | 10 |
| Revenue - Clover | $3.27bn | $3.61bn | $4.07bn | $4.59bn | +10.5% | 12 |
| Revenue - Clover - Software and services | $823.02m | $980.33m | $1.16bn | $1.39bn | +19.1% | 5 |
| Revenue - Clover - Payment | $2.11bn | $2.25bn | $2.49bn | $2.62bn | +6.8% | 5 |
| Revenue - Clover - Hardware | $521.03m | $440.25m | $450.15m | $564.96m | -15.5% | 4 |
| Carat | — | — | — | — | — | — |
| Revenue - Carat | $895.40m | $846.83m | $933.11m | $961.18m | -5.4% | 3 |
Margins reset harder than revenue: Financial Solutions operating margin 45.5% to 41.1%, back only to 41.7%
Financial Solutions never regains its FY-2025 operating-income level in the median model, even by FY-2028; Merchant solutions does, by FY-2027. Adjusted free cash flow per share recovers a year ahead of the dollars, because the share count is shrinking underneath it.
| Line | FY-2025A | FY-2026E | FY-2027E | FY-2028E | YoY | Brokers |
|---|---|---|---|---|---|---|
| Segment margin | — | — | — | — | — | — |
| Operating margin - Merchant solutions - Operating(%) | 35.0% | 31.9% | 32.7% | 33.2% | -3.1pt | 17 |
| Operating margin - Financial solutions - Operating(%) | 45.6% | 41.0% | 41.8% | 41.2% | -4.6pt | 19 |
| Segment profit | — | — | — | — | — | — |
| Operating income/(loss) - Merchant solutions - Operating | $3.56bn | $3.34bn | $3.59bn | $3.81bn | -6.2% | 17 |
| Operating income/(loss) - Financial solutions - Operating | $4.40bn | $3.93bn | $4.13bn | $4.19bn | -10.6% | 19 |
| Operating income/(loss) - Corporate and other - New - Operating | $-551.78m | $-561.62m | $-554.25m | $-519.17m | -1.8% | 19 |
| Group margin | — | — | — | — | — | — |
| Operating margin(%) | 37.4% | 33.5% | 34.2% | 34.9% | -3.9pt | 24 |
| EBITDA margin(%) | 46.5% | 43.4% | 43.6% | 44.1% | -3.1pt | 23 |
| Group cash | — | — | — | — | — | — |
| Adjusted free cash flow (FCF) | $4.28bn | $3.84bn | $4.21bn | $4.55bn | -10.3% | 18 |
| Adjusted free cash flow per share($) | $7.71 | $7.32 | $8.36 | $9.68 | -5.0% | 6 |
The real dispute is the FY-2027 profit pool and how much stock gets bought back
| Line | Period | Median | Q1–Q3 | Min–max | Brokers |
|---|---|---|---|---|---|
| Operating income/(loss) - Merchant solutions - Operating | FY-2027E | $3.58bn | $3.51bn–$3.69bn | $2.88bn–$4.09bn | 16 |
| Operating income/(loss) - Financial solutions - Operating | FY-2027E | $4.11bn | $4.02bn–$4.20bn | $3.75bn–$4.95bn | 19 |
| Share repurchase amount | FY-2027E | $2.00bn | $1.44bn–$2.12bn | $854.00m–$3.60bn | 15 |
| Revenue - Clover | FY-2028E | $4.71bn | $4.56bn–$4.82bn | $3.58bn–$5.13bn | 6 |
The most differentiated lines here are also the thinnest — Clover's product split sits on 2-5 brokers
Group P&L lines carry 22 to 24 brokers through FY-2027, but Clover's hardware, payment and software splits are modeled by 2-5 brokers and Carat by 2-3 — one analyst's assumption moves those medians. FY-2025 columns also carry January and February 2026 revision dates, and Carat's FY-2027 column was last revised 2026-06-10 against 2026-07-24 for the group.
Headline P&L consensus, momentum and beat/miss live in the CapIQ tab.
Source: S&P Capital IQ transcripts via Xpressfeed · latest indexed call 2026-05-05 · generated 2026-07-31.
Latest call digest
Fiserv, Inc., Q1 2026 Earnings Call, May 05, 2026 · 2026-05-05T12:00:00
Q1 2026 call, May 5, 2026. Adjusted revenue of $4.68 billion fell 2.4% and organic revenue fell 3.6%, with adjusted operating margin of 29.7% and adjusted EPS of $1.79. Management framed the quarter as in line with the February guide rather than as progress, and left the full-year frame untouched: organic and adjusted revenue growth of 1% to 3%, adjusted EPS of $8 to $8.30, adjusted operating margin of approximately 34%, and Q2 as the trough.
Prepared remarks and Q&A pointed in different directions. Lyons spent most of his time on execution proof points — Clover value-added services at 27% of Clover revenue and growing 18%, CommerceHub transaction growth up nearly 200%, Finxact accounts and positions up over 70%, time to resolve client inquiries down 27%, high-impact client incidents down nearly 60%, 27 new banks signed as Merchant Referral Partners and the Western Alliance Bank agent bank agreement. Todd's segment detail was the counterweight: Financial Solutions organic revenue down 6% with segment adjusted operating margin of 38.1% against 47.5% a year earlier, Merchant Solutions adjusted operating income down 23%, and core counts down 2% year-over-year.
Analysts pressed on that gap rather than on the strategy. The recurring question was when improved execution reaches the revenue line, and the answer was consistently the second half of 2026 for partial visibility and 2027 for a full year of it. A large share of the specifics analysts asked for — Clover Capital strategy, the non-Clover SMB decomposition, back-book conversion pace, Project Elevate's financial targets, the overall Clover and Merchant strategy — was deferred to the May 14 Investor Day, which left the call itself thin on new disclosure.
Guidance actually stated on the call: 2026 organic revenue growth of 1% to 3%, with Merchant Solutions in the mid-single digits and Financial Solutions flat to slightly down; Financial Solutions declining at the high end of mid-single digits in Q2; Clover revenue growth in the low double digits and Clover GPV growth of 10% to 15% ex the gateway conversion; first-half adjusted operating margin of approximately 31% to 32% and second-half margin of 35% to 36%; free cash flow conversion of approximately 90% of adjusted net income; a full-year adjusted tax rate of 19% to 19.5%; weighted average share count of approximately 530 million; and year-end leverage of approximately 3x.
Participant coverage from the latest call.
| Group | Participants | Count |
|---|---|---|
| Management | Operator; Walter Pritchard — Senior VP & Head of Investor Relations, Fiserv, Inc.; Michael Lyons — Former CEO & Director, Fiserv, Inc.; Paul Todd — Chief Financial Officer, Fiserv, Inc. | 4 |
| Analysts | Tien-Tsin Huang — Senior Analyst, JPMorgan Chase & Co, Research Division; Andrew Schmidt — Research Analyst, KeyBanc Capital Markets Inc., Research Division; Dan Dolev — MD & Senior Equity Research Analyst, Mizuho Securities USA LLC, Research Division; Vasundhara Govil — Managing Director, Keefe, Bruyette, & Woods, Inc., Research Division; Bryan Bergin — MD & Analyst, TD Cowen, Research Division; William Nance — Research Analyst, Goldman Sachs Group, Inc., Research Division; P.C. Chen — Associate Equity Analyst, Wells Fargo Securities, LLC, Research Division; James Friedman — Senior Analyst, Susquehanna Financial Group, LLLP, Research Division; Timothy Chiodo — Analyst, UBS Investment Bank, Research Division; James Faucette — MD & Equity Analyst, Morgan Stanley, Research Division; Ryan Campbell — Research Analyst, Cantor Fitzgerald & Co., Research Division; David Koning — Associate Director of Research & Senior Research Analyst, Robert W. Baird & Co. Incorporated, Research Division | 12 |
Curated latest-call exchanges; one row per analyst topic.
| Analyst | Firm | Topic | What changed in Q&A |
|---|---|---|---|
| Tien-Tsin Huang | JPMorgan | Core banking retention and attrition | Opened the Q&A on visibility into bank retention. Lyons acknowledged core attrition remains above where the company wants it, attributed it to actions taken over the last several years, and described the fixes — client coverage, AI in call centers, supporting all cores, StoneCastle, a client health index. No attrition rate was quantified, and he conceded the progress is not visible in the results. |
| William Nance | Goldman Sachs | When the mid-single-digit algorithm becomes reality | Asked directly whether the company can reach its stated growth level exiting 2026 and into 2027, or whether lingering Financial Solutions attrition and margin investment delay it. Lyons pointed to 2027 as the first full year of clear visible growth and said the efforts are fully funded, but made no commitment on an exit-2026 run rate. |
| Bryan Bergin | TD Cowen | Sizing nonrecurring revenue headwinds in Financial Solutions | Asked for the nonrecurring headwinds by subsegment in Issuing and Banking and their relative size in Q2. Todd named Output Solutions as the biggest single Issuing driver, said there are others across Digital and Banking, then declined to size them and pointed back to the existing Q2 trough guidance. The specific sizing requested was not provided. |
| Timothy Chiodo | UBS | Non-Clover SMB, roughly 20% of company revenue | Asked for organic growth in non-Clover SMB this quarter and recent quarters, what is implied in guidance, and a US/international/ISV split. Todd gave the growth figures — down low single digits in Q1, similar expected in Q2, slight growth for the full year on ISV and international ramp — and deferred the decomposition to Investor Day. |
| Andrew Schmidt | KeyBanc Capital Markets | SMB back book and non-Clover to Clover conversion | Asked how the back book performed ex-Clover and what conversion testing showed. Todd said nothing unique happened in Q1 and expectations for the year are unchanged, with the low end of the GPV guide assuming very minimal back-book conversion. Lyons tied faster conversion to the new PracticePay and Professional Services verticals. |
| David Koning | Baird | Source of the implied second-half Merchant acceleration | Asked what drives the step-up from roughly mid-single digits in the first half to high single digits in the back half. Todd attributed the Clover portion largely to fourth-quarter comparatives — the prior-year pricing rollbacks and November volume weakness — rather than to new demand drivers, alongside ISV and international contribution in non-Clover SMB. |
| James Friedman | Susquehanna | Competitive landscape in Issuing and Banking | Framed the question around investor anxiety about a changing landscape. Lyons said he sees no major changes in the competitive landscape, pointed to Finxact's position in modern core, and redirected to Fiserv's own service and delivery execution as the variable that matters. |
Theme tracker
Themes are curator-classified across supplied calls.
| Theme | Status | Quarters mentioned | Read-through |
|---|---|---|---|
| Clover positioned as a small-business operating platform rather than a payments device | persisted | Q2 2023, Q3 2023, Q4 2023, Q1 2024, Q2 2024, Q3 2024, Q4 2024, Q1 2025, Q2 2025, Q3 2025, Q4 2025, Q1 2026 | Clover has been the lead topic on every call in the window, but the framing shifted. Through 2024 it was a revenue-target story with hardware launches, VAS penetration and new countries. From Q3 2025 it became a pillar of the One Fiserv plan, with the emphasis moving to verticals, distribution and client experience. The consistency of the topic makes the change in supporting metrics — from revenue targets to GPV and attach rates — easier to miss. |
| Argentina, from transitory tailwind to disclosed headwind | persisted | Q2 2023, Q3 2023, Q4 2023, Q1 2024, Q2 2024, Q3 2024, Q4 2024, Q1 2025, Q2 2025, Q3 2025, Q4 2025, Q1 2026 | Argentina appears on all twelve calls, but the sign flips. In 2024 it was quantified as a transitory benefit that management stripped out to show normalized growth. In Q3 2025 it was recast as one of four causes of the reset, with a holistic view of its historical contribution. By Q1 2026 lower Argentine inflation and interest rates were a revenue headwind, largely offset below the line. The topic never went away; the disclosure framing changed three times. |
| Converting the non-Clover SMB back book to Clover | persisted | Q2 2023, Q4 2023, Q2 2024, Q3 2024, Q4 2024, Q3 2025, Q4 2025, Q1 2026 | Analysts have raised back-book conversion for roughly three years and the answer has stayed deliberately incremental. Q3 2025 promised thoughtful conversion starting in 2026; Q4 2025 described narrow targeting of select US merchants; Q1 2026 said nothing incremental happened and the low end of the GPV range assumes very minimal conversion. It is now embedded in guidance as an option rather than a plan, which is worth noting given how long it has been discussed. |
| Core banking attrition and client service failures | emerged | Q3 2025, Q4 2025, Q1 2026 | Absent from the calls before the reset, though Q2 2025 flagged slower-than-expected banking implementations and greater pricing competition. Since Q3 2025 it has been a standing disclosure: lost share on the smaller credit union side, attrition above target, and a stated fix list. This is the clearest example of a problem that was invisible in the call record until the CEO's review surfaced it, which is itself information about the prior disclosure. |
| One Fiserv action plan and Project Elevate | emerged | Q3 2025, Q4 2025, Q1 2026 | Introduced with the Q3 2025 reset and structured around five pillars, with Project Elevate as an AI-led transformation run alongside IBM. Costs have been disclosed before benefits — $73 million of expense in Q4 2025 with more to come in 2026 — and the financial targets have been deferred to the Investor Day across three consecutive calls. |
| Stablecoin and agentic commerce capabilities | emerged | Q2 2025, Q3 2025, Q4 2025, Q1 2026 | FIUSD was introduced in Q2 2025, extended with the StoneCastle custody license, and by Q1 2026 the pilot was scheduled for the summer. Agentic commerce entered in Q3 2025 and now features on every call. Both are described in terms of capability and partnership rather than revenue, so they are not yet testable against results. |
| Clover's $3.5 billion 2025 and $4.5 billion 2026 revenue targets | dropped | Q2 2023, Q4 2023, Q1 2024, Q2 2024, Q3 2024, Q4 2024, Q1 2025, Q2 2025 | The $3.5 billion 2025 target was reaffirmed as late as Q2 2025 and the $4.5 billion 2026 target was still being defended on that same call. Q3 2025 reset Clover revenue to $3.3 billion against the original $3.5 billion guidance, and the $4.5 billion figure has not been mentioned since. Clover guidance is now expressed as a growth rate rather than a dollar milestone, which removes a marker investors had tracked for two years. |
| The consecutive-year double-digit adjusted EPS streak | dropped | Q3 2023, Q4 2023, Q1 2024, Q2 2024, Q4 2024, Q1 2025 | Under the prior CEO the streak was a recurring framing device, cited as recently as Q1 2025. It disappears entirely from Q2 2025 onward. Double-digit adjusted EPS growth is still the stated ambition, but it is now positioned as starting in 2027 rather than as an unbroken record, and 2025 adjusted EPS declined modestly year-over-year. |
Guidance ledger
Quotes, calls, and speakers are source-verified; outcomes are curator-classified.
| Verbatim guidance | Call | Speaker | Curator outcome | Outcome note |
|---|---|---|---|---|
| “we're raising our adjusted earnings per share outlook to $8.65 to $8.80, an increase of $0.05 across the range” | Fiserv, Inc., Q2 2024 Earnings Call, Jul 24, 2024 · 2024-07-24T12:00:00 | Frank Bisignano | kept | The Q4 2024 call reported full-year adjusted earnings per share of $8.80, at the top of the range. |
| “we are raising organic revenue growth from 15% to 17% to 16% to 17% and raising our guidance for adjusted earnings per share to $8.73 to $8.80” | Fiserv, Inc., Q3 2024 Earnings Call, Oct 22, 2024 · 2024-10-22T12:00:00 | Frank Bisignano | kept | The Q4 2024 call reported 16% total company organic revenue growth and adjusted EPS of $8.80 for the year. |
| “For 2025, we are guiding the 10% to 12% organic revenue growth, greater than 125 basis points of adjusted operating margin expansion; 15% to 17% adjusted EPS growth; and roughly $5.5 billion of free cash flow.” | Fiserv, Inc., Q4 2024 Earnings Call, Feb 05, 2025 · 2025-02-05T13:00:00 | Frank Bisignano | missed | Cut to approximately 10% in Q2 2025 and then to 3.5% to 4% in Q3 2025; the Q4 2025 call reported 3.8% organic growth, adjusted EPS of $8.64 versus $8.80 in 2024, free cash flow of $4.44 billion and a 200 basis point decline in adjusted operating margin. |
| “We are maintaining our full year 2025 guidance of organic revenue growth of 10% to 12% and adjusted earnings per share in the range of $10.10 to $10.30, representing 15% to 17% adjusted EPS growth.” | Fiserv, Inc., Q1 2025 Earnings Call, Apr 24, 2025 · 2025-04-24T12:00:00 | Robert Hau | missed | Reaffirmed one quarter before the first cut. Full-year 2025 organic revenue growth came in at 3.8% and adjusted EPS at $8.64, per the Q4 2025 call. |
| “we have refined our full year organic revenue growth guidance to approximately 10%, which is at the low end of our guidance range” | Fiserv, Inc., Q2 2025 Earnings Call, Jul 23, 2025 · 2025-07-23T12:00:00 | Michael Lyons | missed | Cut again three months later to 3.5% to 4%; the year finished at 3.8%. |
| “we are maintaining our guidance for $3.5 billion of Clover revenue this year” | Fiserv, Inc., Q2 2025 Earnings Call, Jul 23, 2025 · 2025-07-23T12:00:00 | Michael Lyons | missed | The Q3 2025 call lowered the expectation to $3.3 billion, and the Q4 2025 call confirmed Clover revenue finished the year at $3.3 billion. |
| “We now expect to achieve 3.5% to 4% organic revenue growth based on the revenue-related impacts detailed earlier.” | Fiserv, Inc., Q3 2025 Earnings Call, Oct 29, 2025 · 2025-10-29T12:00:00 | Michael Lyons | kept | The Q4 2025 call reported annual organic revenue growth of 3.8%, in the upper half of this range. |
| “We expect full year 2025 adjusted EPS to be $8.50 to $8.60, representing a modest decline year-on-year.” | Fiserv, Inc., Q3 2025 Earnings Call, Oct 29, 2025 · 2025-10-29T12:00:00 | Michael Lyons | kept | Annual adjusted EPS came in at $8.64, above the guidance range, per the Q4 2025 call. |
| “Putting it all together, we expect adjusted EPS of $8 to $8.30.” | Fiserv, Inc., Q4 2025 Earnings Call, Feb 10, 2026 · 2026-02-10T13:00:00 | Paul Todd | pending | Reiterated unchanged on the Q1 2026 call. Q1 2026 adjusted EPS of $1.79 included a $0.17 benefit from an 11% tax rate that management called strictly timing-related. |
| “In the first half, we expect adjusted operating margin of 31% to 32%, with Q1 representing the low point just below 30%.” | Fiserv, Inc., Q4 2025 Earnings Call, Feb 10, 2026 · 2026-02-10T13:00:00 | Paul Todd | kept | Q1 2026 adjusted operating margin was 29.7%, which Todd described as in line with the just below 30% view. The first-half range itself is not yet complete. |
| “We continue to expect Clover revenue growth in the low double-digits for 2026 and GPV growth of 10% to 15% ex the gateway conversion.” | Fiserv, Inc., Q1 2026 Earnings Call, May 05, 2026 · 2026-05-05T12:00:00 | Paul Todd | pending | Q1 2026 Clover revenue grew 6% reported, which management said would be mid-teens excluding prior-year nonrecurring revenue, on Clover volume growth of over 9% reported and 12% ex the gateway conversion. |
Q&A pressure map
Question counts and firms are curator tallies; analyst coverage shown above.
| Topic | Questions | Firms | Pressure / response |
|---|---|---|---|
| Credibility of the reset and when growth becomes visible | 9 | Wolfe Research, JPMorgan, Baird, Bernstein, Goldman Sachs | The single most pressed topic across the last four calls. Analysts asked what changed between the July and October 2025 guides, whether the review is genuinely complete, and how a recurring-revenue segment could deteriorate that fast in two months. Management's answers have been consistent — the review is done, the baseline is solid, the fixes are within the company's control — but the proof keeps moving forward a quarter, from second-half 2026 to full-year 2027. |
| Clover growth, yield and the withdrawn revenue targets | 9 | UBS, Goldman Sachs, William Blair, Wells Fargo, Bernstein, KBW, Morgan Stanley | Persistent questioning on the spread between Clover volume and revenue, VAS attach, yield maintenance and Clover Capital penetration. The pattern is that reported Clover growth is repeatedly explained by adjustments — fee eliminations, gateway conversion runoff, prior-year nonrecurring revenue — so analysts keep asking for the underlying rate. Management's answer has settled on a mid-teens fundamental rate against low double-digit reported growth. |
| Non-Clover SMB and back-book conversion | 5 | Baird, Autonomous Research, Bernstein, KeyBanc Capital Markets, UBS | Roughly a fifth of company revenue sits here and it has been flat to declining. Analysts have asked repeatedly for the drivers of the assumed return to slight growth. Answers have given direction but not composition, and on the Q1 2026 call the decomposition was explicitly deferred to the Investor Day. |
| Banking attrition and Financial Solutions reacceleration | 5 | KeyBanc Capital Markets, Susquehanna, Bernstein, JPMorgan | Analysts have asked what clients are actually saying and what has to change for the segment to grow. Lyons has answered with process and investment detail and with a statement that 2025 attrition was above target but stable versus 2024 and 2023. No attrition rate, retention rate or lost-account count has been given on any of these calls, which leaves the central claim — that the curve is bending — unverifiable from the call record. |
| Nonrecurring revenue and comparability | 3 | TD Cowen, Goldman Sachs, KBW | Because so much of the reported decline is attributed to lapping nonrecurring revenue, analysts have asked for that revenue to be sized. Bergin's Q1 2026 question asked specifically for the relative size of the Issuing and Banking headwinds in Q2; the answer identified Output Solutions, acknowledged other items across Digital and Banking, and then redirected to the existing trough guidance without sizing them. Lyons had said the prior quarter that it is hard to go through every single item. |
| Margin trajectory and the cleanliness of the expense base | 3 | Bernstein, JPMorgan, Baird | Questions have focused on how much of the elevated spend is structural versus transitional, including a direct Q4 2025 question about how clean the implied exit-year 36% margin is. Todd said there is no material expense ramp beyond what is baked in and that Project Elevate costs will shift from professional services toward technology. |
Language shifts
Only language evidence verified against the referenced component is shown.
| Observation | Verbatim evidence | Call ID | Component |
|---|---|---|---|
| The streak framing that anchored the prior CEO's confidence disappears after Q1 2025. It is the last call on which the consecutive-year record is invoked; from Q2 2025 onward double-digit adjusted EPS growth is described as an ambition starting in 2027 rather than an unbroken record being extended. | “can extend our track record of 39 consecutive years of double-digit adjusted EPS growth” | 1939097020 | 2 |
| Q3 2025 introduces reset vocabulary that had no precedent in the prior eight calls. The word appears repeatedly on that call and the framing is explicitly corrective rather than incremental, which marks the sharpest single-quarter change in register across the window. | “While disappointing, the actions we are taking are driven by a rigorous analysis of the company conducted during the third quarter and represent a critical and necessary reset and a revitalizing moment for the company.” | 1964393802 | 2 |
| The same call pairs the reset with a containment phrase. Read as evidence rather than intent, it draws a boundary around the problem — execution and forecasting rather than positioning — and that boundary has held in every subsequent call. | “Another important takeaway from our analysis is that nothing at Fiserv is fundamentally broken.” | 1964393802 | 2 |
| Attrition becomes a named, standing disclosure from Q4 2025. The formulation is careful: above target but not deteriorating. It is the first time the call record puts a direction on core client losses, and it is still given without a rate. | “Specifically on core client attrition in 2025, it was above where we wanted to be, but stable with where it was in 2024 and 2023.” | 1978891396 | 23 |
| By Q1 2026 confidence is expressed through metrics that are not in the financial statements, with an explicit acknowledgment that the reported numbers do not yet support the claim. The construction — improving execution, not yet visible results — recurs several times on the call. | “So our execution is improving across both businesses, but as expected, that progress is not yet visible in our reported financial results” | 1996095516 | 2 |
| New external risk vocabulary appears in Q1 2026 that was absent from the prior calls in the window: a named geopolitical driver tied conditionally to consumer spending mix, cross-referenced to the company's own Small Business Index data. | “Going forward in Merchant, we're watching the impact of various environmental factors, including higher gas prices from the conflict in the Middle East, which, if sustained, can impact the mix of consumer spending.” | 1996095516 | 2 |
Across twelve quarters the call record shows reported revenue and margins deteriorating while the volume, transaction and account metrics management points to have stayed broadly stable. That is the crux of the current debate: the reset removed the old targets and the guidance since has been met, but no quarter yet demonstrates the underlying stability converting back into reported growth. The Q1 2026 call deferred most of the specifics to the Investor Day, so the case still rests on management's timetable rather than on evidence in the numbers.
Competitors describe Fiserv, Inc.'s market in their own filings and calls. These verified passages and visual pages show where their strategies meet, using source documents preserved in Sources.
Fidelity National Information Services, Inc. (FIS)
FIS is the only peer here that meets Fiserv on both sides of its business at once: core account processing and digital banking sold to banks and credit unions, and card issuer processing, where its purchase of Global Payments' Issuer Solutions (TSYS) added scaled credit capability. It is also the company analysts turn to first when they want a second opinion on Fiserv's core-platform consolidation. Capital Markets commentary is out of scope here; only the Banking and payments discussion is used.
An analyst puts a rival's core-platform consolidation to FIS and asks whether it will shake loose RFPs. The competitor is not named on the call; Fiserv disclosed on its own Q3 2025 call that it needs to "consolidate our core systems from sixteen to five," which matches the roughly two-thirds reduction described in the question. Ferris does not claim a windfall — she says annual core transitions remain minimal and stickiness is substantial — while noting FIS ran the same exercise years earlier and now sits on three strategic platforms. Read against Fiserv, this is the nearest competitor arguing that core consolidation is normal housekeeping rather than an opening, which cuts against both the bear case on Fiserv attrition and the bull case for FIS share gains.
Trevor Williams (Jefferies) asking; Stephanie Ferris, CEO, answering: I wanted to inquire about the competitive dynamics in core processing. One of your major competitors is reducing the number of cores they operate by about two-thirds. Could this situation potentially lead banks to issue a request for proposal, and how much of an opportunity might this present for you to acquire new business? […] Overall, there is a noticeable trend in the industry towards bank modernization, primarily driven by end markets that demand enhanced digital capabilities, account opening features, and real-time transaction functionalities. To effectively roll out new products and services, banks need to approach this modernization in a modular way. This trend remains significant in the market, with each player at different stages of product and solution delivery. While discussions about platform consolidation have emerged, our company underwent this process a few years ago and currently operates on three strategic platforms, which we are pleased with. We made considerable investments in modernization, reflected in our increased capital, and have managed to decrease expenses over time. Even though movements in the market present opportunities for competition, annual core transitions remain minimal, as there is substantial stickiness in this business. We are satisfied with our renewal rates and have been successful in retaining existing clients. While we recognize the potential for growth, the market is competitive, characterized by many renewals and strong client retention. We are committed to competing and focusing on our clients' bank modernization journeys. We are nearing the end of transitioning from many systems to a few, and we're now dedicated to ensuring our efforts help banks deliver products to their clients more efficiently.
p. 8 · Read in context →
FIS sizing the two US markets it shares with Fiserv's Financial Solutions segment: a $10 billion digital-solutions TAM growing about 12% a year through 2028, and a $53 billion payments TAM growing 5% a year, with debit issuing transactions at 6%. These are FIS's own estimates on an earnings call, not third-party market research, and the boundaries FIS draws around "digital" and "payments" are its own. They are useful mainly as a competitor's stated view of how large and how fast-growing the bank-technology pools are, and of where growth is claimed to be concentrated — instant payments and digital currencies rather than the steady debit base.
Stephanie Ferris, CEO, prepared remarks: The U.S. TAM for digital solutions is $10 billion, growing at approximately 12% annually through 2028. Banks are spending aggressively on digital capabilities and open banking adoption is accelerating. We're capitalizing on this by embedding AI-powered capabilities such as predictive insights and hyper-personalized recommendations into our Digital One platform to deliver a more seamless, intelligent digital banking experience. Clients are also prioritizing solutions with seamless integration and robust API connectivity, which are core strengths of our platforms. […] Payments is the other major growth driver, and the momentum here is equally compelling. We're operating in a $53 billion U.S. TAM that is growing 5% annually. Card issuing debit transactions remain robust at 6%, providing a steady foundation. But the real market acceleration is in instant payments and digital currencies, which represent the future of money movement and areas where FIS is strategically invested. The complexity of this growing market is creating new opportunities for FIS as banks increasingly rely on us to help them navigate the changing landscape. And we're seeing this in our sales performance. Our payment sales have been outstanding, showing 50% recurring sales growth year-to-date and a 5% improvement in win rates.
p. 2 · Read in context →
Asked whether Visa's Pismo is changing the competitive picture, FIS draws the distinction that governs how exposed an incumbent core book is to new entrants: Pismo is "a ledgering capability," not "a full end-to-end core," so large-bank core modernisation buys ledgering without replacing the core. Ferris then makes two share claims of her own — that FIS is the largest credit card processor in the US, and that more than 35% of its total issuing contracts are already renewed out through 2029. Both are management assertions without a cited source, and the renewal figure is a share of contracts, not of revenue. The same ledger-versus-core distinction is the one to apply to Fiserv's account-processing base.
Stephanie Ferris, CEO and President, answering Ramsey El-Assal (Cantor Fitzgerald) on Visa's Pismo signing core business with Wells Fargo: And I think you probably heard from one of my competitors, Pismo isn't a core. It's a ledgering capability. So as you think about very large banks as they do core modernization, they're looking for ledgering, but we don't think it significantly changes the overall core market. It isn't a full end-to-end core. In terms of — so for Pismo in terms of core banking, I don't see them materially moving anything in the market. With respect to Wells, we have absolutely no impact on that. And so the last thing I'd say on Pismo obviously they've expanded or they brought it to market in terms of credit and debit. We feel really good about the total issuing capabilities there. We are the largest credit card processor in the U.S. And are happy to report that we have greater than 35% of our total issuing contracts have been renewed out through 2029. So even anything happening with Pismo in the credit world, we feel really good about our competitive positioning. So are hopeful that some of this underlying concern around Pismo starts to die away now.
p. 6 · Read in context →
Global Payments Inc. (GPN)
Global Payments is Fiserv's most direct merchant-acquiring rival and the peer whose 2025 reshaping — buying Worldpay, selling Issuer Solutions to FIS — was aimed squarely at the market Fiserv's Merchant Solutions segment serves. Its Genius point-of-sale platform is the product built to take the ground Clover occupies, and it names Fiserv first in its own competition disclosure.
Global Payments' Form 10-K competition disclosure. Fiserv is named first in the US merchant-acquiring list, ahead of Chase Paymentech, Elavon, Toast, Stripe, Shopify and Block, and first again in the issuer list that is now reported as a discontinued operation. Two changes from the FY2024 version are worth noting: Worldpay has dropped off the acquiring list because Global Payments bought it, and the issuer paragraph no longer forecasts an expanding competitor count. A competitor list in a 10-K signals which firms a company expects to meet in deals; it says nothing about relative share.
Our Merchant Solutions segment competes with financial institutions, merchant acquirers and other financial technology companies that provide businesses with merchant acquiring, business management software and related services. In the United States, we compete with a large number of providers, including but not limited to Fiserv, Inc. ("Fiserv"), Chase Paymentech Solutions, LLC, Elavon, Inc., a subsidiary of U.S. Bancorp, Bank of America Merchant Services, Wells Fargo Merchant Services, Toast, Inc., Stripe, Inc. ("Stripe"), Shopify Inc. and Block Inc. ("Block"). While these are our primary competitors in the merchant acquiring space, our vertically focused businesses in the United States compete with numerous other providers in their respective verticals. Internationally, financial institutions remain the primary providers of payment technology services to merchants, although the outsourcing of these services to third-party service providers is becoming more prevalent. We compete outside the U.S. with financial institutions in the markets in which we operate, as well as providers such as Worldline, Nexi, Adyen, Block and Stripe. We have seen competition internationally increase and expect that trend to continue as new companies enter our markets and existing competitors expand or consolidate their product lines and services. […] Issuer Solutions, which is presented as a discontinued operation, encounters competition from other third-party payment card processors, the card brands, core banking platform providers, independent software vendors, B2B providers, and various other firms that deliver services to payment card issuers in the markets we serve, as well as financial institutions who provide such service in-house. Our competitors in this business include, but are not limited to, Fiserv, FIS, Marqeta, Nexi, Worldline, i2c, Bill.com, AvidExchange, Billtrust, Adyen, Stripe and Zeta.
p. 11 · Read in context →
Global Payments' scale claim in its first set of prepared remarks after closing Worldpay and divesting Issuer Solutions: over 6 million merchant locations in more than 175 countries, a direct sales force of more than 5,500 including roughly 1,500 sellers inherited from Worldpay, more than 1,700 financial-institution partners, and approximately $4 trillion in annual payments volume. The location and volume counts are the closest thing in this corpus to a like-for-like scale marker against Fiserv's merchant business, though neither company defines the metrics the same way and none of these figures are audited. Two claims are the company's own and unsourced: that the resulting TAM exposure is "unmatched by any single competitor," and that its scale lets it be "highly price competitive where we choose" — the second is the one that matters for Clover pricing if it is acted on.
Cameron Bready, CEO, prepared remarks: Our advantage starts with our worldwide omnichannel reach, serving over 6 million merchant locations across online, in-store, and in-app experiences in more than 175 countries. This breadth provides meaningful diversification and exposure to the full Global Payments TAM that is unmatched by any single competitor. Our advantage also extends from our go-to-market approach. We compete on product differentiation, service, reliability, and fit to customer need, supported by a direct sales force of more than 5,500 professionals worldwide including approximately 1,500 experienced sellers from Worldpay. Alongside our direct channel, we operate a vibrant partner ecosystem with more than 1,700 financial institutions and thousands of software and platform partners, complemented by a robust dealer network that involves Genius and supports customers end to end. For merchants preferring self-service, we offer options as well for streamlined install, reporting, upgrades, and enhancements, all without human interaction. And with approximately $4 trillion in annual payments volume, our scale enables us to serve the largest global enterprises to small merchants alike and everything in between, being highly price competitive where we choose, while still leading on capability and service.
p. 1 · Read in context →
Global Payments states the doctrine that governs the fight with Clover: "the mode of competition is the point of sale." Cortopassi then puts roughly 50% of merchant revenue in the SMB channel today and says very close to 100% of that base can eventually be addressed by some version of Genius, with 75% to 80% of served MCC codes covered across Europe and Latin America. These are statements about addressable coverage, not booked business; the international figure counts merchant-category codes rather than merchants or volume, and Bready's own caveat is that an increasing share of sales will arrive through the integrated channel where Global Payments does not own the software.
Cameron Bready, CEO, then Robert Cortopassi, COO, answering Bryan Keane (Citigroup) on how much of the market Genius covers: But as I step back and think about the long-term strategy of the business, as we think about restaurant and retail, the mode of competition is the point of sale. And obviously, Genius is a highly competitive solution that we think allows us to compete enormously effectively in restaurant and retail and all the subverticals under them with our capabilities to continue to win share in that market going forward. Over time, the rest of the market will continue to drive towards being more software enabled, which means more and more of our sales will come through our integrated channel for channels where we don't own our own software. […] Yes, Brian, I think it's an interesting question as Cameron noted. Clearly, retail and restaurant is the most obvious direct application for Genius in the core verticals that we serve. But we've also announced releases around service-oriented businesses with scheduling and invoicing capabilities. We've also launched Genius Mobile, which is a version that is slightly slimmer in terms of both its device footprint and its feature functionality that's designed to be easier to use and more general purpose. The other thing I would consider is as you move outside of the largest markets in the world for software, the U.S. certainly being at the top of that. In international markets, merchant segments tend to be less hyperverticalized than here, and there aren't quite as many software providers with niche solutions. And so we think Genius covers more of the horizontal approach to the market than maybe in the largest markets. So if you think about the composition of Global Payments merchant revenue today with something like roughly 50% being driven by the SMB channel, I think over a period of time, very close to 100% of that SMB base can be addressed by a version of Genius that isn't already served by our integrated and platforms business or by another core software offering customers use to operate their business. So in the U.S. today, it's largely retail, restaurant, age-restricted verticals and service-oriented. In our international markets, it's covering probably 75% to 80% of the MCC codes that we're serving across Europe and Latin America.
p. 8 · Read in context →
Block, Inc. (XYZ)
Square is the product Clover is measured against. Block sells the same integrated point-of-sale, software and payments bundle to the same restaurants, retailers and service businesses, and it has spent 2025 and 2026 rebuilding the distribution — field sales, telesales and now independent sales organizations — that Fiserv reaches through banks and ISOs. Only the Square discussion is used here; Cash App, Afterpay and bitcoin are out of scope.
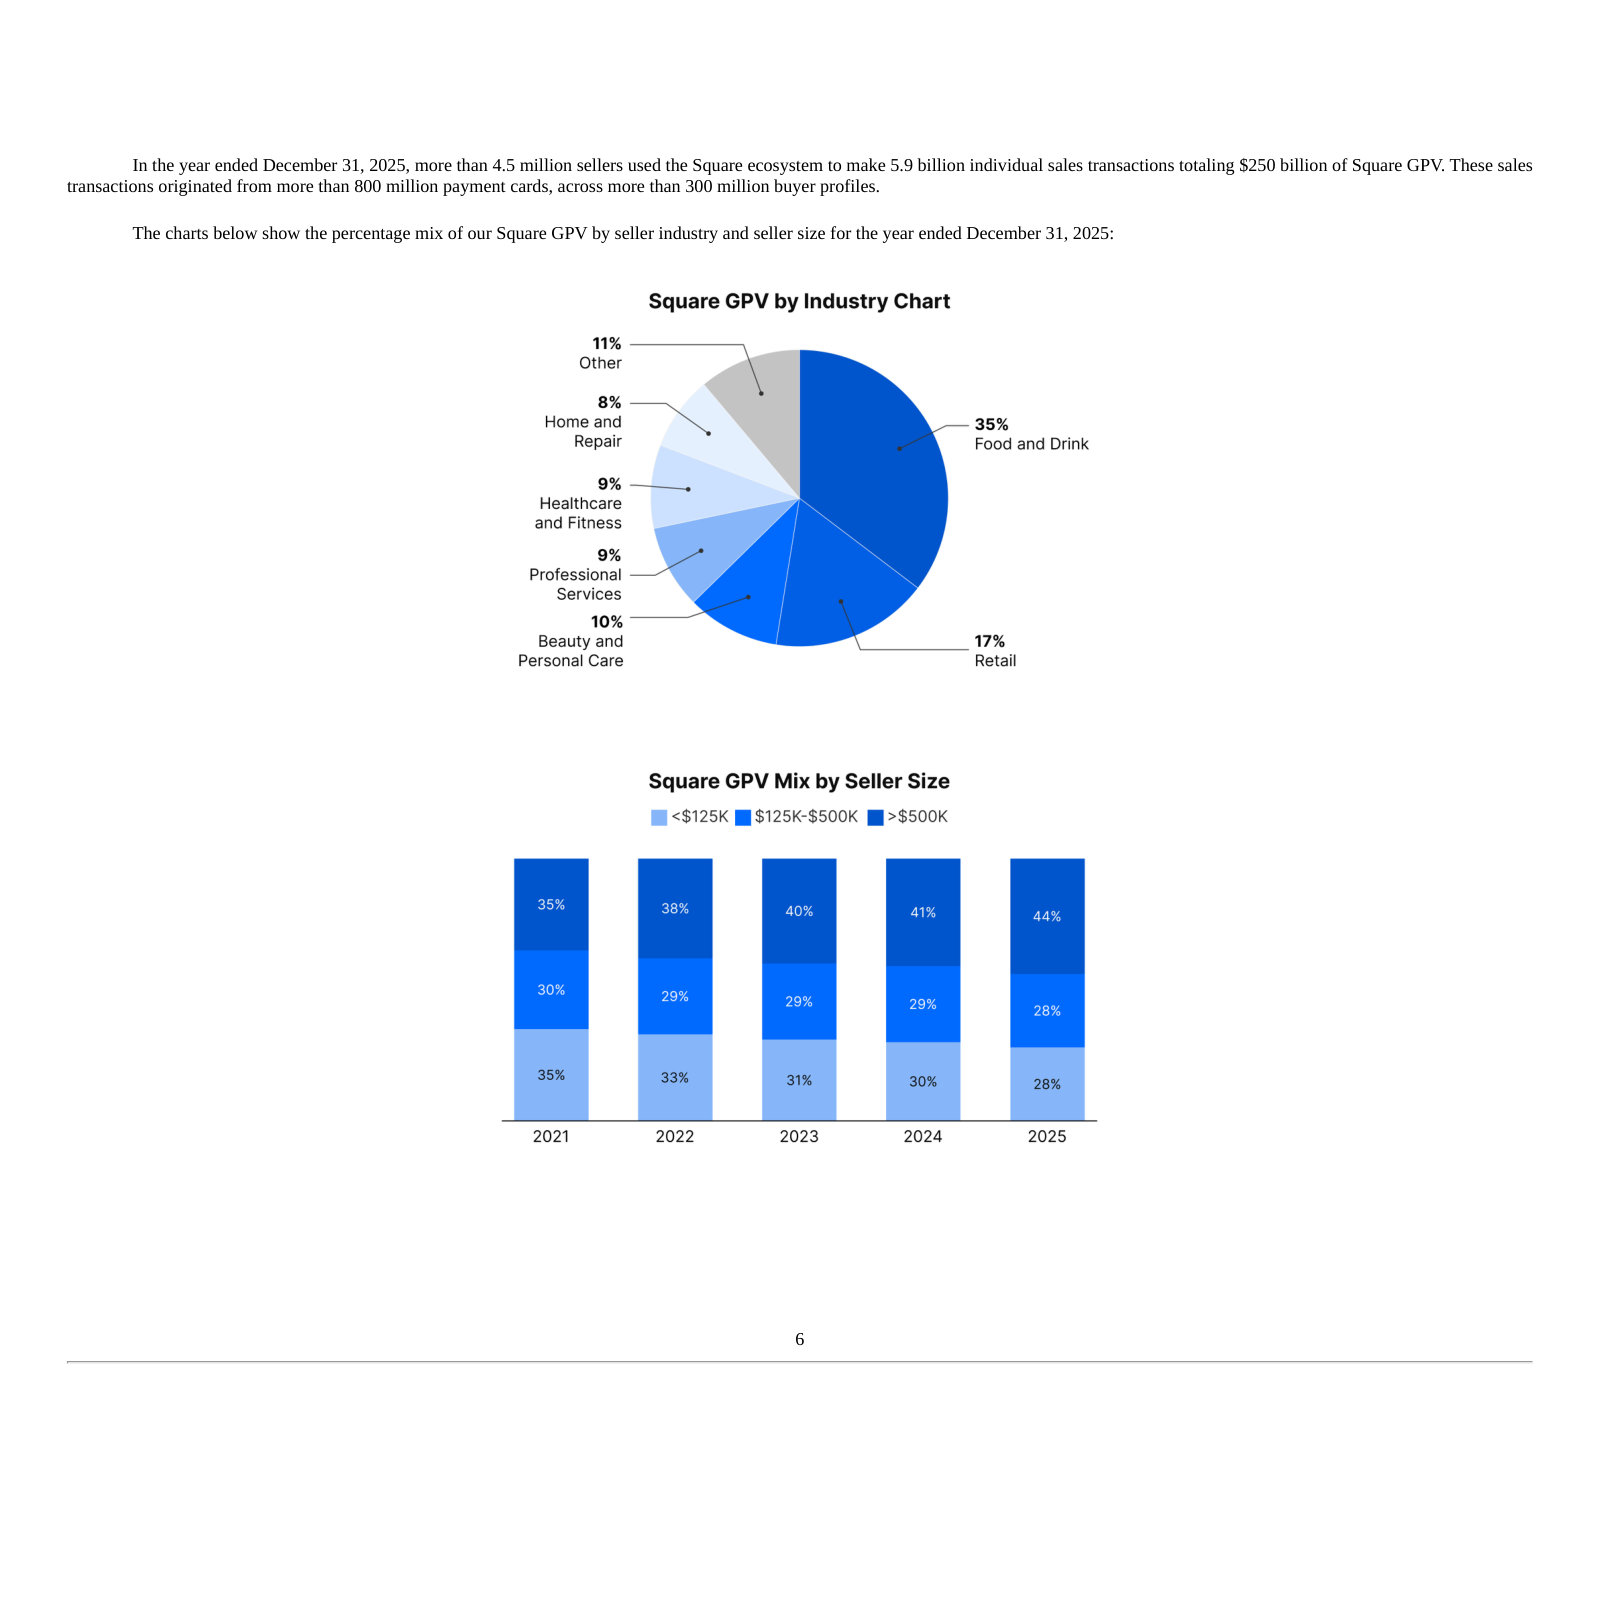
Block's most recent Square numbers: GPV growth accelerating to 13% (11.5% in constant currency), food and beverage sellers at 21% and mid-market sellers at 22%, both described as the strongest since Q1 2023, and international GPV up 35%. The last sentence is the distribution point — more than 140 active independent sales organisation partners, ramping quickly. ISOs and bank referral channels have historically been Fiserv's structural advantage in SMB acquiring, so a competitor building that channel is a change in the terms of the fight, not just a growth statistic. Figures are Block's own and unaudited.
Amrita Ahuja, CFO, prepared remarks: Turning to Square, where gross profit and GPV growth accelerated in the first quarter to 9% and 13%, respectively. On a constant currency basis, GPV grew 11.5% year-over-year, improving across both the U.S. and internationally. We accelerated GPV growth from food and beverage sellers to 21% year-over-year and from mid-market sellers to 22% year-over-year, both reflecting the strongest growth rates we've seen since Q1 2023. International GPV grew 35% year-over-year or 26% on a constant currency basis. We sustained strong new volume added growth across both the U.S. and internationally, reflecting the high ROI field sales investments we made throughout 2025. We are beginning to more meaningfully scale our independent sales organization or ISO partnerships and now have more than 140 active ISO partners who are ramping quickly.
p. 1 · Read in context →
Asked where Square's new volume is coming from and whether pricing has moved, Block gives two answers worth separating. On price, Jennings says he does not believe Block has made any major payment-pricing moves and that it has been "pretty business as usual" — a competitor declining to claim price as the lever. On volume, he describes a field sales team built from zero to more than 100, the lowest churn since Q2 2023, and "pretty meaningful win backs of those that have gone to direct competitors." The win-back and win-rate claims are unquantified management characterisations, but the direction — a competitor reclaiming sellers it had previously lost — bears directly on how contestable the installed SMB base is.
Jason Kupferberg (Wells Fargo) asking; Owen Jennings, Business Lead, answering: So you've made it really clear that you feel pretty good about the competitive momentum on the Square side of the business. I wanted to get a sense, you talked about all that new volume coming in. Is it coming more from sellers who haven't made the move to a cloud solution yet? Or is it coming more from other cloud-based providers? And then I'm just wondering if there's been any changes in the Square pricing environment, either in terms of seller sensitivity to price or pricing posture that you're seeing exhibited by your competitors? […] Yes, why don't I take this? So let me just start with the pricing point. I don't believe there's been any major significant payment pricing moves that we've made as a result of focusing on our go-to-market and as I scale the team. From my perspective, it's been pretty business as usual. And more specifically, I think a lot of what we've seen is that we're showing up in a lot more conversations as a result of getting out in the field. The field sales team going from basically 0 to over 100 today, and it will be meaningfully larger by the end of the year. That, from my point of view, is a major contributor to our ability to have greater consideration and put us in more conversations to have the chance to win. We're also seeing our telesales growth rate improving and pretty meaningfully internationally. We've seen a significant acceleration of NVA growth. So very excited about the U.S. and how we're showing up, but our telesales performance in all our global markets is seeing a highly accretive NVA growth curve. We're also seeing some of the lowest churn rates that we've seen since Q2 2023. A lot of that is a function of the investments we have made. We're showing up and supporting our partners. To wrap up the question, a lot of the wins that we're having, yes, some of them are kind of the legacy point-of-sale systems. But we, in recent times, have had pretty meaningful win backs of those that have gone to direct competitors. We're seeing really strong win rates across all aspects of our competitor base, and many who had left are seemingly coming back as we're continuing to show up and having those conversations. I'm really proud of the team and proud of what's been delivered this quarter.
p. 9 · Read in context →
Jack Henry & Associates, Inc. (JKHY)
Jack Henry competes with Fiserv's Financial Solutions segment for the same community banks and credit unions, and it is the only large core provider that publishes a count of competitive core wins each quarter. It has also made Fiserv's core-platform consolidation an explicit part of its sales pitch, which makes its disclosures the closest thing in this corpus to a running scoreboard on core attrition.
Jack Henry's own scoreboard: 22 competitive core wins in the quarter, four at institutions above $1 billion in assets, and 68% of new core wins attached to digital and card processing versus 45% a year earlier. Management says a rival's core consolidation announcement has helped its pipeline while explicitly crediting the quarter's wins to its own execution rather than to that announcement — a distinction worth keeping when the same event is used elsewhere as a Fiserv attrition thesis. The eight-year share figures are relative growth in Jack Henry's own client counts, not levels of market share, and are unaudited.
Gregory Adelson, President and CEO, prepared remarks: Second, regarding our sales performance. Our core sales team had a remarkable quarter, achieving 22 competitive core wins. Out of these, four were financial institutions with assets exceeding $1 billion, and 15 involved core digital banking and card solutions. We've witnessed a rise in trifecta wins over the past year, with 68% of new core wins this quarter including digital and card processing, compared to 45% in Q2 of fiscal year '25. The recent core consolidation announcement by one of our competitors has positively influenced our sales pipelines for core payment and complementary solutions. We anticipate our historic success rates within this client base to persist and likely accelerate based on current insights. It’s important to highlight that the timing of their core consolidation announcement had a minimal effect on our sales success in Q2; our achievements were primarily due to our ongoing demonstration of innovation and service differentiation, not only in comparison to that competitor but across the competitive landscape. […] Third, we are continuing to succeed in a consolidating market. We have consistently surpassed our competitors in core market share growth, despite the overall decline in the number of financial institutions. Over the past eight years, our core market share among banks has increased by 17%, while our credit union market share has expanded by 40%. Among institutions with more than $1 billion in assets, our market share has risen by 32% for banks and 12% for credit unions in the same timeframe. This growth occurred even as the average overall market contracted by 3% for both banks and credit unions over the last eight years.
p. 1 · Read in context →
The most specific attribution in the corpus: of 17 core wins in the quarter, Adelson says 13 came from one provider. He immediately qualifies it — core contracting runs nine to twelve months, so most of those deals were in motion before any consolidation announcement, and wins came from every competitor. The provider is not named. Jack Henry's core competitors, on its own 10-K listing, are FIS, Fiserv, Corelation and Finastra, so the concentration is informative even without the name, but attributing all 13 to any single company would go beyond what the transcript supports.
Vasundhara Govil (KBW) asking; Gregory Adelson, President and CEO, answering: It was another very strong quarter on new core wins. I'm curious what's driving this trend? And if you are starting to already see some benefits from the competitor platform consolidation or if that's still to come? […] Yes. Thanks for the question. Yes, I think it's a combination of both. We've been talking a lot about what we've been doing on the innovative side. And so that's continued to play out with the products and the solutions. Obviously, our customer service hasn't wavered a bit. I will tell you, of the 17 core wins, 13 of them came from one provider and one competitive provider. But I will say that most of those, as you can imagine, the core processing contracting side takes anywhere from nine to 12 months typically. So a lot of those were already in motion ahead of whatever announcements were made. But we did take some from really everybody, just so you know. So we had some wins from really all of our competitors. But again, the bulk of them came from one.
p. 5 · Read in context →
A competitor talking its book, and worth reading as such. Adelson says RFP activity has not meaningfully increased despite the consolidation news and points out that Jack Henry is the only provider that publishes a core-win count — a fair observation about disclosure asymmetry when comparing win claims across this group. Carsley then makes the sharpest characterisation of a rival anywhere in this corpus, describing "their long-standing lack of innovation" as having already created demand. That is an assertion by a direct competitor, not a finding, and the competitor is not named.
Darrin Peller (Wolfe Research) asking; Gregory Adelson, President and CEO, and Mimi Carsley, CFO and Treasurer, answering: Can I quickly follow up on the competitive landscape for a moment? I know this was discussed earlier, but the core consolidation at one of your competitors has been talked about a lot. Considering your expectations for core additions, have you noticed any changes in the market regarding the volume and level of RFPs in the last 6 to 12 months? […] Regarding the time frames you mentioned, a lot of recent news has emerged, including the announcement at their client conference about consolidating the cores, which has become more pronounced recently. However, I wouldn't say that the activity has significantly increased beyond what we've seen. I do expect some uptick whenever core consolidations are announced. As for capacity, we are fully prepared and can scale up as needed. We regularly manage this based on our mergers and acquisitions and new core wins. We're proficient at bringing on teams and have no concerns about that. Additionally, we've made significant advancements in AI for handling RFP responses, so we are confident in managing an increased volume of RFPs. The sales team is actively working on this, and I believe we are on the right path. I want to emphasize that we're starting Q2 strong with competitive core wins. It's also worth noting that we are the only company that announces our number of core wins, whereas others reference increases without releasing specific figures, which puts us under a different level of scrutiny. […] I agree that we are likely to experience an increase in interest and opportunities due to our competitors' core consolidation announcement. Their long-standing lack of innovation has already created demand for us to present our innovative solutions. This represents a potential acceleration. Many clients may wait until the end of their contract to change, but it presents an exciting opportunity as it reinforces our message that a change is necessary.
p. 10 · Read in context →
Adyen N.V. (ADYEN)
Adyen competes for the enterprise and platform accounts Fiserv serves through Carat, and its Platforms pillar — embedding payments, capital, issuing and business accounts into software providers — targets the same ISV and software-partner channel Clover and Fiserv's Merchant segment rely on. Adyen also lists Fiserv in its own disclosed peer group. Only the commercial and volume discussion is used here.
Adyen's self-description, and the central competitive claim behind it: a single platform built entirely in-house replacing "a fragmented, multi-party setup." That sentence is the argument made against acquirers whose stacks were assembled through acquisition, Fiserv among them. The three pillars matter for mapping the overlap — Unified Commerce is the omnichannel enterprise business that competes with Carat, and Platforms is the embedded-finance offer aimed at the software partners Clover distributes through. The in-house and end-to-end claims are Adyen's own characterisation of its architecture.
Adyen is the financial technology platform trusted by the world’s leading businesses. We simplify global commerce by replacing what is traditionally a fragmented, multi-party setup with a single platform built entirely in-house. […] We organize our commercial activities into three pillars. […] Unified Commerce connects online and in-person payments for global retailers, hospitality, and food & beverage groups. Platforms enables software providers to embed payments and financial services, including capital, issuing, and business accounts, into their offerings. With this foundation, Adyen supports the full spectrum of how money moves for the world’s largest enterprises and the fastest-growing software platforms through a single, scalable solution.
p. 9 · Read in context →
The volume disclosure that shows where Adyen is pushing. Processed volume reached €1,394.3 billion in 2025, but point-of-sale volume — the in-person terminal business that overlaps most directly with Clover and with Fiserv's merchant estate — was €310.9 billion, or 22% of the total, up from 18% a year earlier. Take rate rose to 17.0 basis points from 15.5, which Adyen attributes to merchant mix rather than to pricing. Figures are reported in euros on a non-IFRS net revenue basis and are not directly comparable to Fiserv's US-dollar merchant metrics.
Net revenue for 2025 was €2,364.2 million, up 18% from the prior year. On a constant currency basis, net revenue grew 21% YoY. Growth was driven by executing on our priorities: scaling with our existing customer base, onboarding complex enterprise and platform businesses, and investing in the foundational infrastructure required to power global commerce at scale. […] Processed volume for 2025 was €1,394.3 billion, up 8% YoY. Of processed volumes, 84% were full-stack volumes, up from 83% in 2024. In 2025, our point-of-sale volumes were €310.9 billion, comprising 22% of total processed volume, up from 18% in 2024. This growth reflects the strength of our in-person payments offering across pillars and verticals. Full-year take rate for 2025 was 17.0 bps, up from 15.5 bps in 2024. This increase was driven by changes in the overall merchant mix.
p. 16 · Read in context →
Nexi S.p.A. (NEXI)
Nexi is the scaled European incumbent in the merchant acquiring and issuer processing markets Fiserv entered through First Data and still serves from Europe, and it is named alongside Fiserv in Global Payments' own issuer-competitor list. Its reporting is the clearest read in this corpus on European digital-payment growth rates, which sit behind the international line of Fiserv's Merchant segment.
A competitor's account of how fast the European digital-payments market is actually growing: nominal growth decelerating from +12% in 2022 to +5% in 2023 and +2% in 2024, with a further slowdown to about +6% in payment transactions estimated for 2025, and physical POS terminals in Italy up only 2% after 6.9% the prior year. The figures are drawn from Banca d'Italia and Milan Politecnico and are heavily Italy-weighted, so they describe Nexi's home market more precisely than Europe as a whole. They are a useful counterweight to the mid-to-high single-digit secular growth assumptions usually applied to payments.
Market trends in 2024 confirm a further slowdown in digital payments as a result of the weakening consumer economy (falling from +12% in 2022 to +5% in 2023, and to +2% in 2024 in nominal terms), although digital payment penetration has continued to grow steadily by around 2 percentage points each year since the pandemic. […] Data from Banca d’Italia show that cash withdrawals are falling even more than in the previous year (-1% in 2023 and -3% in 2024), while payments continue to rise, albeit more slowly, recording +7.5%. In 2025, based on data observed in the first half of the year, Milan Poly technic estimates a further slowdown in payments (+6%). […] Structural dynamics are also accompanying the transition to digital payments, but they also slowed. According to the Banca d’Italia’s Annual Report, there were 3.3 million physical POS devices in circulation at the end of 2024, an increase of +2% over the 6.9% of the pre vious year, while the number of ATMs fell from 46 thousand in 2023 to 44.7 thousand in 2024 (-2.8%).
p. 16 · Read in context →
Nexi's own account of its scale and its dependence on banks. More than 42 billion transactions and Euro 1,822 billion of value handled across acquiring and issuing in 2025, on the same page that splits the group into three business lines — Merchant Solutions, Issuing Solutions and Digital Banking Solutions — mapping closely onto Fiserv's own Merchant and Financial Solutions split. The last sentence is the structural point: where Nexi sits in the value chain, and whether an activity is run internally or outsourced, varies with "the nature of the Group's relationships with partner banks." That is the same bank-distributed model Fiserv relies on across much of Europe, and it means the two compete for bank partnerships as much as for merchants. The volume figures are pro forma and unaudited, and count volumes handled directly or through partners rather than by Nexi alone.
Present in over 25 countries, Nexi is one of the leading players operating in the digital payments sector in Europe […] In 2025, directly or through its partners, the Nexi Group managed an aggregate volume of more than 42 billion transactions for the entire value chain on the acquiring front and on the issuing front, corresponding to a total amount of Euro 1,822 billion (pro forma data) […] The services provided by this company unit can be subdivided into payment processing services, payment acceptance services (or acquiring services), and POS management services. Nexi operates under several service models, which vary depending on the nature of the Group’s relationships with partner banks, which vary and, therefore, determine value chain presence, and the relative activities are managed internally and/or outsourced depending on the service models.
p. 21 · Read in context →
More peer documents
JKHY_annual_report_FY2025 — 66 pages · Jack Henry's own Form 10-K competition section, which names Fiserv as one of only four core competitors alongside FIS, Corelation and Finastra, and states that provider consolidation in bank and credit-union technology has run for more than a decade and is expected to continue (p12). · Open →
GPN_annual_report_FY2024 — 128 pages · The prior-year competition disclosure, which still lists Worldpay as a US acquiring competitor and still expects the issuer competitor set to keep expanding — the baseline for reading how the FY2025 wording changed (p11). · Open →
Q2_FY2025 — 14 pages · Global Payments' Q2 2025 call: the Worldpay deal rationale in management's own words, with the nearly $4 trillion and 100 billion transaction framing used to claim "unmatched global scale" (p3). · Open →
Q4_FY2025 — 11 pages · FIS's Q4 2025 call: management answering an analyst on issuer-processing competitive dynamics as larger networks move into the space (p6-7), and its claim of having renewed or extended relationships accounting for approximately 30% of total issuing revenue over the prior twelve months with no large renewals pending in 2026 (p2). · Open →
FIS_annual_report_FY2025 — 112 pages · The 10-K Competition section (p9) plus the risk factors on clients keeping work in-house, emerging technologies unbundling bank solutions, and smaller and mid-size clients exerting pricing pressure at renewal (p17-18) — the same renewal dynamic Fiserv faces in Financial Solutions, described by the closest comparable filer. · Open →
ADYEN_annual_report_FY2024 — 262 pages · Adyen conceding a "still relatively small market share — even in our most commercially established regions, like EMEA" (p12), and the disclosed peer-group table that lists Fiserv among payment platforms (p85). · Open →
Q4_FY2025 — 13 pages · Block's Q4 2025 call: Dorsey answering whether AI is a competitive vector where Block can leapfrog the incumbent point-of-sale providers, and what gives Block the right to win there (p12). · Open →
NEXI_annual_report_FY2024 — 382 pages · The prior-year Reference Markets section, needed to check whether the European growth deceleration Nexi describes is a trend or a single-year restatement — it shows the same series a year earlier at +14% in 2022 and +6% in 2023 (p15). · Open →
The answer
Does not fit the framework (P1 not met); contested: X2, P2, P3c, P3d, P5
The year-10 gate is not met, and under the framework's own order of operations that settles it: nothing offsets a failed gate. Confidence is low, on the tally's computed basis — name-mask divergence or load-bearing probability divergence exceeded 0.20. The prior-driven-risk flag is set. No exclusion screen was hit and the watchlist-only flag does not apply. Five criteria came back contested: X2, P2, P3c, P3d and P5.
The gate rule the tally applied, in its own words: P1 not_met leads to does_not_fit, with nothing able to offset it. Everything below the gate — an 11.2% adjusted free-cash-flow yield, a volume spike at 7.4 times the pre-fall median, a share count down 19.7% in five years — is recorded, and none of it changes the answer.
Universe and exclusions
Both universe tests are met and no exclusion was hit. Fiserv's common stock is primary-listed on the Nasdaq Global Select Market under the ticker FISV, having transferred from the New York Stock Exchange on 11 November 2025 where it traded as FI [1]; the issuer is incorporated in Wisconsin and is neither an ADR nor a Chinese issuer. Market capitalisation is $30.56 billion — 549.0 million shares at the 29 July 2026 close of $55.67 — which is 3.06 times the $10 billion floor. The cushion is the residue of a collapse rather than a stable state: the same shares were worth roughly $130 billion at the March 2025 peak, and a further 67.3% decline from here would be needed to breach the floor.
Four exclusion screens and the China sensitivity flag were checked against evidence. The company manufactures nothing: all $21,193 million of FY2025 revenue is merchant acquiring and financial-institution processing [2], so the car-company exclusion has no subject. Structural decline was checked and not found on the filed annual record — revenue rose in every fiscal year from 2017 to 2025 — and the trial's probability that the impairment is temporary, 0.61, sits well above the 0.35 line at which a strongly-permanent diagnosis becomes a hit. The consensus-saturated-darling screen fails in the other direction: at 1.44 times FY2025 sales Fiserv is cheaper than each of its four listed comparables, which run 2.1 to 5.0 times, trades at roughly 6.8 times guided 2026 earnings, carries a Hold consensus with 69.4% of ratings neutral, and is 80.2% below its peak. On China, the FY2025 Form 10-K discloses no China revenue and no China assets, the renminbi is absent from the five currencies management names as material, and all non-US-and-Canada revenue is 16% of the total spread across EMEA, Latin America and Asia-Pacific combined [3] — an inference from silence rather than a disclosed zero, and recorded as such in the data gaps.
The promotion screen, X2, is the one that split the jury, and it split across model families. Here is the deciding point. In February 2025 management guided FY2025 to 10-12% organic revenue growth and $10.10-$10.30 adjusted EPS [4], reaffirmed the Clover target in July with the statement that "only the timing of realizing them has been extended" and that "we are maintaining our guidance for $3.5 billion of Clover revenue this year" [5], then on 29 October 2025 reset the same year to 3.5-4% organic growth and $8.50-$8.60 adjusted EPS [6]. Free cash flow came in at $4.44 billion against roughly $5.5 billion originally guided [7]. All fifteen current directors and executive officers together hold 324,298 shares [8], about 0.06% of the company. Both prongs of the test are evidenced, which is what two seats found. The counter-fact sits in the same treatment and is why the other two seats did not: the chief executive who made those promises resigned on 12 June 2026 [9] and the president resigned for good reason on 7 July 2026 [10], the reset baseline was then beaten — FY2025 adjusted EPS of $8.64 against the $8.50-$8.60 range, free cash flow of $4.44 billion against $4.25 billion guided, at approximately 93% conversion [11] — and insiders bought about $1.72 million of stock in the open market at the June 2026 low. The tally records the result as contested, not as a hit.
Verdicts and vote splits from the run's deterministic tally; the NASDAQ listing record from Item 5 of the FY2025 Form 10-K [12], total revenue and operating income from Item 1 [13], and beneficial ownership from the 2026 proxy statement [14].
Pattern match
Fiserv fits none of the reader contract's four setups, and in three of them the mismatch is not close.
The large-bank cyclical pattern needs a bank: a lender whose monthly loss-rate data can be read against macro fear. Fiserv sells to banks and is examined alongside them, but it carries no credit book to price. The high-dividend pattern needs a dividend, and Fiserv has never paid one and states it does not anticipate paying one [15]; the framework's dividend-cover criterion, P4c, is recorded not applicable for exactly that reason.
The insurance-forecasting-error pattern is the closest in shape and still fails its own check. The shape rhymes: a single year's guidance cut, and a share price taken down roughly with it as though the cut were permanent. But that pattern's specific check is a repricing mechanism — premiums reset, the book readjusts, and mean reversion is structural rather than discretionary. Fiserv has no equivalent. Its recovery is a company-specific revenue and margin bridge: management's own second-half 2026 waterfall builds from low-single-digit first-half growth to 6-8%-plus in the second half, of which roughly half — about 3.5 percentage points — is a non-recurring 2025 comparison lapsing rather than new demand [16]. Half of the mechanism is arithmetic; the other half has to be executed.
The quality-monopoly-on-a-fear-dip pattern splits the company in two. One half qualifies structurally: the US bank and credit-union core-processing market is a four-vendor set — Fidelity National Information Services, Fiserv, Corelation and Finastra, per Jack Henry's own Form 10-K [17] — and Fiserv is examined directly by the Federal Reserve, the FDIC and the OCC as a significant service provider under the Bank Service Company Act [18]. That protected half is the one contracting: Financial Solutions organic revenue fell 6% in the March 2026 quarter with all three business lines negative, and segment adjusted operating margin fell to 38.1% from 47.5% [19]. The growth half is described by Fiserv's own Item 1 as a market that "is fragmented, highly competitive, and served by a multitude of large and small businesses" [20], where the company's own estimate of its revenue share is 7% in US small-and-medium business and 2% in global enterprise [21]. The precedent behind that pattern is a specific, testable outside fear against an intact franchise. The fear here is about the franchise's own printed numbers.
The pillar ledger
Year-10 durability — P1 not met
This is the gate, and it is the only criterion in the run that is binary by construction. All four seats returned not met, cross-family, at a trimmed-mean probability of 0.605 with a spread of 0.09 — the tightest agreement on any probabilistic criterion in the run. The masked seat returned the same answer at 0.63.
The revenue leg is not what fails. Revenue rose in each of the nine fiscal years from FY2017 to FY2025, $5,696 million to $21,193 million [22], so the framework's disqualifier — high-single-digit revenue decline for three consecutive years — is not triggered, and even the depressed 1-3% 2026 guidance compounded for a decade leaves year-10 revenue above today's.
The cash leg is what fails. Adjusted free cash flow on the framework's basis — reported free cash flow less share-based compensation less the trailing five-year average of acquisition spend — fell 20.7% in FY2025, from $4,297 million to $3,408 million, built from $6,062 million of operating cash flow, $1,763 million of capital expenditure, $357 million of share-based compensation and $820 million of acquisition payments [23]. In the March 2026 quarter consolidated operating income fell 34% to $918 million on revenue of $5,027 million [24], an operating margin of 18.3% against 27.2%. Of the framework's five conviction sources, capital intensity is not one here — capital expenditure including capitalised software ran 8.3% of revenue, which is not the capital-heavy essential the framework treats as structurally defended — and market structure covers only the shrinking half of the company.
The strongest surviving counter-fact sits in the same treatment, and it is a commitment rather than a result: at the 14 May 2026 Investor Day management committed to a 2027-2029 adjusted revenue CAGR of 4-6%, a 2029 adjusted operating margin above 37%, approximately 90% free-cash-flow conversion and over $13.5 billion of cumulative free cash flow across 2027-2029 [25]. The gate asks for very high conviction and resolves genuine doubt downward; a plan presented by a chief executive who resigned 29 days later [26] is evidence, not conviction. The full treatment is in Durability.
FCF consistency — P2 contested
Two seats found the consistency standard met and two returned cannot-determine, and the disagreement is about which series to measure rather than about the numbers. On the reported basis every rolling five-year average rose: $2,505 million (FY2018-22), $3,022 million (FY2019-23), $3,619 million (FY2020-24), $3,830 million (FY2021-25) — up 52.9% across the windows, with a coefficient of variation of 9.8% and no negative year in eight [27]. The framework asks the question on adjusted free cash flow, and that series cannot be built: the two seats from the second model family recorded the missing datapoint as five consecutive years of adjusted FCF, including SBC and trailing acquisition-average deductions, for rolling 5-year stability, and a complete rolling five-year adjusted FCF series with SBC and acquisition-spend data. Reconstructed from the filings, adjusted free cash flow exists for FY2023-FY2025 only, and the FY2023 term is distorted to $18 million by the $15,083 million First Data purchase sitting inside its five-year window.
The counter-fact: the most recent year broke the trend the average records. Reported free cash flow fell 15.1% in FY2025 and the reconstructed adjusted figure fell 20.7%, so the rising average is being carried by FY2023 and FY2024.
Dislocation and yield — P3a and P3b met, P3c and P3d contested
The event and the capitulation are unanimous. A dated, filed trigger exists: the 29 October 2025 release cut FY2025 adjusted EPS guidance from a $10.225 midpoint to $8.55, a 16.4% reduction, and the shares fell 44.0% in that session, the largest one-day decline in a price record running back to 1990 [28]. The counter-fact in the same treatment: the medium-term 9-12% organic growth target was withdrawn on the same call, and the shares had already fallen 46.9% from the March 2025 peak before any guidance changed. On capitulation, the measured volume multiple is 7.39 times the 180-day pre-peak median against a 2-times reference line — 41.4 times on the reset day alone, with 67.2% of the share count trading in the four weeks that followed. The counter-fact: volume has never normalised, running 1.7 to 4.9 times the pre-fall median in every month since April 2025 and still 2.4 times in July 2026, which reads as a register still changing hands rather than a single flush.
P3c and P3d both split 2-2, and both splits turn on one unresolved input: which bar applies.
The yield itself is not in dispute. Adjusted free cash flow of $3,408 million on a $30,563 million market capitalisation is 11.15%. Against the framework's 10% moderate-balance-sheet bar that is 115 basis points through; against the 25% levered bar it is 1,385 basis points short. The classification is genuinely unsettled. Total debt at 31 December 2025 was $28,997 million — $1,239 million short-term and current maturities plus $27,758 million long-term [29] — against $798 million of cash and EBITDA of $9,025 million, giving 3.12 times, just over the rule's 3.0-times cut-off. Excluding $2,112 million of finance-lease and other financing obligations the same computation gives 2.89 times; the consensus data set gives 2.89 times on its own definitions; and management reports 3.0 times at year-end 2025 against a standing 2.5-3.0 times target [30]. The two seats from one model family read the class as moderate and recorded P3c met at plus 115 basis points; the two from the other applied the literal 3.12-times reading, took the 25% bar, and recorded not met at minus 1,385. A third figure cuts against both: the three-year average adjusted yield as the formula literally computes it is 8.42%, 158 basis points below even the moderate bar, though excluding the 2019 First Data window it is 11.71%.
P3d carries the widest disagreement in the run — a trimmed-mean probability of 0.42 on a spread of 0.67, with seat readings of 0.72, 0.73, 0.06 and 0.12. The underlying arithmetic is the same for all four: consensus free cash flow of $3,880 million for FY2026 and $4,280 million for FY2027 becomes 10.33% and 12.25% after deducting share-based compensation and averaged acquisition spend, which clears 10% and falls 1,467 and 1,275 basis points short of 25%. The skeptic weakened this claim rather than letting it stand unqualified, precisely on that point. The counter-fact: FY2026 headroom over the moderate bar is 33 basis points, and the plan requires roughly 400 basis points of second-half margin expansion that no reported quarter has yet shown. The full workings are in Yield, the drawdown anatomy in Dislocation.
Balance sheet and self-help — P4a not met, P4b met, P4c not applicable
P4a failed unanimously, and only on its second leg. The outlasting leg passes comfortably: 2026 maturities are $1,239 million against total debt of $28,997 million [31], an $8.0 billion revolver runs to August 2030, and the sole financial covenant is a 3.75-times leverage test [32] against roughly 15% of headroom. The allocation condition is what fails. In the fourth quarter of 2025 Fiserv repurchased 3 million shares for approximately $200 million and paid down over $1 billion of debt [33]; in the March 2026 quarter it repurchased 3.3 million shares for approximately $200 million again while stating that "we are focused on managing our leverage ratio and remain committed to returning capital to shareholders" [34]; and in June 2026, with the shares at their $47.18 low, it issued EUR 1.0 billion of new notes to fund a tender for existing ones. The levered exception does not rescue it: of its three legs, the yield leg fails at 11.15% against roughly 25%, free cash flow as a share of revenue fell from 24.7% to 20.3%, and only the share-count leg holds. The counter-fact: the same Investor Day commits the "Majority of free cash flow directed to stock buybacks while targeting low-end of 2.5-3.0x" over 2027-2029 [35] — buybacks promised, but sequenced behind the leverage target.
P4b was met unanimously because the framework's hard-fail condition is a rising share count and the count is falling: diluted weighted-average shares went from 683.4 million in FY2020 to 549.0 million in FY2025, a compound rate of minus 4.29%, on $22,987 million of executed repurchases, including 32.2 million shares for $5.6 billion in FY2025 alone [36]. The counter-fact is the price paid and the timing: the average cost of those 174 million shares was about $132 against today's $55.67, quarterly spend fell 90.8% from $2,164 million in the March 2025 quarter to $200 million in the March 2026 quarter while the price fell 72.6%, and no shares were bought in December 2025 or January 2026. P4c is not applicable — no dividend has ever been paid [37], so the coverage test has no subject and the entire shareholder-return channel runs through the repurchase decision. The maturity schedule and buyback record are worked in Self-Help.
Diagnosis — P5 contested
All four seats recorded P5 as contested and all four carried the same number rather than re-deriving it: the adversarial trial's probability that the impairment is temporary is 0.61, on a per-judge range of 0.62, 0.38 and 0.61, a spread of 0.24 and a reading-order gap of 0.125 between the judge who read the temporary brief first and the two who read the permanent brief first. Nine exhibit quote-checks failed across both briefs, several as materially out of context.
The arithmetic that supports the temporary reading is the size of the gap. Equity value fell $101.3 billion from the March 2025 peak. The present value of the cash the reset actually removed computes to $50.7 billion even under a permanent level shift measured against the growth algorithm management withdrew — a $50.6 billion gap, or 2.0 times; measured against the milder anchor the ratio is 4.5 times. The counter-fact in the same treatment: enterprise value fell $96.7 billion, or 62.2%, not 76.8%, because net debt rose $4.6 billion over the window, and the March 2025 peak multiple of 23 times was struck on a guidance path management later attributed in part to an Argentine inflation windfall. Both cases are put fairly in Damage Math, which reports the ruling and does not override it.
Source: the run's adversarial trial tally; recorded probability 0.61, spread 0.24. No filing page applies.
Instrument context — I1 not verifiable
All four seats returned not verifiable, and the reason is sourcing rather than absence. The single docket entry on listed options was ruled unverifiable for want of a corpus-verifiable source on a load-bearing input, so its content — a chain running to 21 January 2028, 72,599 contracts of open interest on that expiry, and implied volatility of 46.98% at the long end — cannot support a finding under the run's verified-evidence-only rule. The same entry puts that longest expiry at 17.7 months from 31 July 2026, short of the framework's 18-month preference. This criterion never blocks a pillar; it drives the watchlist-only overlay, which applies only to a fits or leans-fit verdict and is therefore recorded false here. The dated facts and their sources are set out in Clock.
Verdicts, splits, probabilities and spreads from the run's deterministic tally; the arithmetic is drawn from the surviving claims cited above, principally the FY2025 Form 10-K cash-flow statement [38] and debt note [39].
What a 3x in three years would require
The framework's target test cannot be stated as arithmetic in this run. The tally records the re-rating math as unavailable because the applicable bar or normalized adjusted FCF is missing: the bar, the normalized adjusted free cash flow, the implied market capitalisation at bar-yield and the upside to it are all null. Both inputs are missing for the same reason the P3c and P3d splits exist — the balance-sheet class is unresolved between the 10% and 25% bars, and the feature file returns the framework's adjusted free-cash-flow series as not computable. No price at bar-yield is asserted here, and none should be inferred from the figures above.
What can be stated is the distance and the base rate. A tripling from the 29 July 2026 close of $55.67 is $167.01, which would still leave the shares roughly 30% below the March 2025 peak of $237.79. Consensus is nowhere near that: the mean twelve-month target of $66.63 is 19.7% above the close and 72.0% below the peak, and FY2027 adjusted EPS estimates have drifted from $9.15 to $8.93 over 180 days rather than turning up. Against the company's own record, this drawdown has no precedent — at 80.2% it is 1.56 times deeper than the worst of the six prior 30%-plus episodes since 1990. Those six round-tripped in a median of 19.8 months, but the two nearest in depth, in 2002 and 2007-08, each took 41 to 42 months, and both were market-wide falls with market-wide recoveries. The episode record is set out in Clock.
Derived: peak, trough and current prices from the run's capitulation gauge; consensus mean target as of 30 July 2026; the three-times figure is 55.67 multiplied by three and is arithmetic, not a target.
Contested and undetermined
Five criteria are recorded contested. No criterion was returned cannot-determine at the tally level, so the overall verdict carries no undetermined component — though P2 is contested precisely because two of the four seats individually returned cannot-determine on it.
Splits and probabilities from the run's jury dockets and deterministic tally; the underlying figures are cited in the pillar sections above.
Provenance
Source: the run's jury dockets, trial tally and refutation ledger. No filing page applies.
Two features of that table carry more weight than the rest. The verdict-bearing criterion was pressed hardest and held best: two independent model families reached the same not-met answer on the year-10 gate, at probabilities within nine points of each other, and the name-masked seat reached it too. The confidence tier is nonetheless low, because the tally computes confidence from disagreement wherever it appears, and disagreement here is real — a 0.67 spread on the forward-yield path, a 2-2 split on which balance-sheet bar applies, and a name-mask probe that came back divergent on the exclusion screens. On X1, X3 and X4 the masked seat recorded the same substantive no-hit under a different label; on X2 and on the P3d probability the divergence is genuine.
Source: the run's jury dockets. Seats A, B and the masked seat are one model family; seats C and D are the second. No filing page applies.
The falsifier ledger
Eighteen standing conditions were recorded, several of them near-duplicates arising from different judges' rulings on the same question. They are the run's what-would-change-this conditions, and they run in both directions: some would break the recovery reading, others would confirm it. The first of them resolves within a week of this writing, when the June 2026 quarter reports on 6 August 2026.
Summarised from the run's falsifier ledger; the exact recorded wording of each entry follows below. No filing page applies. The 2H 2026 revenue bridge behind entries 6, 10, 14 and 15 is management's own [40]; the 2029 algebra behind entries 9, 11 and 18 is the 14 May 2026 medium-term outlook [41].
The entries as recorded, verbatim. Bracketed document-and-page tokens are the run's internal source keys, not links; each resolves to the filing page cited elsewhere on this tab.
Data gaps
The run could not answer the following, and several of them bear directly on the contested criteria above.
- The framework's own yield basis is not computable from the feature file. Adjusted FCF, the adjusted yield, the yield baseline, FCF stability, the balance-sheet class and float-retirement years all return not computable, because the structured cash-flow feed carries no share-based-compensation or acquisitions line for any fiscal year. This is a feed gap, not a disclosure gap — Fiserv discloses both lines in every filed cash-flow statement — and every adjusted figure on this tab was rebuilt from the filings and labelled as derived. Two consequences are load-bearing: the applicable bar (10% versus 25%) is unresolved, which is what P3c and P3d split on; and the missing datapoints recorded against P2 are five consecutive years of adjusted FCF, including SBC and trailing acquisition-average deductions, for rolling 5-year stability, and a complete rolling five-year adjusted FCF series with SBC and acquisition-spend data.
- The adjusted series cannot reach far enough back. FY2018 acquisition spend is not in the corpus, so adjusted FCF is computable only for FY2023-FY2025, and the FY2023 window is distorted by the $15,083 million First Data purchase. The feature file also records a five-year acquisition average of zero for FY2022-FY2025, which the filings contradict.
- The revenue series in the feature file stops at FY2021, because the structured income file carries no revenue for FY2022-FY2025. The disqualifier flags were computed on that truncated window; extending the series from the filings does not change either flag.
- The quarter that tests the whole recovery has not printed. No Q2 FY2026 results exist as of 31 July 2026 — the latest statements are for the quarter ended 31 March 2026 — so the second-half margin and revenue inflection that both guidance and consensus depend on has no reported data point, and repurchase activity through the 22 June 2026 low is unobservable.
- Web research was unavailable for this run (the search provider returned insufficient credit). No third-party record of the pre-reset FY2026 consensus path could be gathered; the option-chain and implied-volatility facts were sourced directly from Stock Options Channel, Barchart and AlphaQuery with publication dates recorded, which is why I1 is recorded not verifiable rather than resolved.
- Consensus history is short and partial. The estimate feed's revision history extends only 180 days, to 31 January 2026 — three months after the reset — and covers only FY2027 and FY2028, so the consensus path through the decisive 2025 revisions cannot be reconstructed; the company's own guidance midpoints stand in for it. Consensus free-cash-flow means carry no analyst count, so the breadth behind the forward yield path cannot be verified.
- Positioning data is thin. The official short-interest feed returned zero rows for FISV, plausibly a consequence of the November 2025 ticker change, and third-party trackers disagree materially; only the qualitative conclusion — short positioning under about 4% of shares outstanding — is supportable. Institutional flow is observable only at the 5% Schedule 13G threshold and at proxy dates, so most of the 2.50 billion shares traded since the peak cannot be attributed to identified holders.
- Competitive and share data comes from the company and its peers, not from an independent source. Fiserv's own Form 10-K names no specific competitors, only categories; every named competitor here comes from peer filings. All market-share percentages are Fiserv's own Investor Day estimates produced by a proprietary methodology, and the corpus holds no independent third-party share series for either merchant acquiring or core processing. Peer price-to-sales comparisons are not like-for-like at the revenue-definition level.
- Two disclosure-level gaps remain open. No China revenue or asset figure is disclosed anywhere, so the S1 conclusion is an inference from silence rather than a disclosed zero; and Fiserv publishes no adjusted-EBITDA reconciliation in the FY2025 Form 10-K, so the EBITDA behind the 3.12-times leverage reading is built from reported operating income plus depreciation and amortisation while management's own sub-3.2-times measure uses an adjusted figure the filings do not reconcile.
What This Tab Establishes
Fiserv sells the processing plumbing that banks and merchants run on — $21.19 billion of FY2025 revenue, split roughly half merchant acquiring, half bank core processing, card issuing and digital payments [1]. It is a US company with a primary Nasdaq listing and a market capitalisation near $30.6 billion, so both universe tests clear. Its two halves have opposite market structures. The auto, China and darling-positioning screens do not bite.
Orientation — What Fiserv Actually Sells
Fiserv describes itself as a global provider of payments and financial services technology. It sits between two client bases that never meet: the merchants who accept card payments, and the banks and credit unions whose deposit and loan systems, card programs and bill-pay rails it operates. Management's own framing of the demand is the most useful line in the filing — "most of the products and services we provide are necessary for our clients to operate their businesses and are therefore non-discretionary in nature" [2]. Eighty percent of FY2025 revenue was processing and services revenue, earned as account and transaction fees under multi-year contracts [3].
FY2025 Revenue ($M)
FY2025 Operating Income ($M)
Market Cap, 29 Jul 2026 ($M)
Employees
Sources: revenue and operating income, FY2025 Form 10-K Item 1 and segment note [4]; headcount, Human Capital [5]; market capitalisation derived as 549.0 million shares outstanding times the $55.67 close on 29 July 2026.
Merchant Solutions ($10.14 billion of FY2025 revenue) acquires and processes card transactions for businesses of every size. Its centre of gravity for small business is Clover, the cloud point-of-sale and business-management platform Fiserv calls a leader in omnichannel commerce for small merchants [6]. Enterprise merchants buy payment orchestration, gift-card and stored-value programs; a third line simply processes for banks, ISOs and other resellers who own the merchant relationship themselves [7].
Financial Solutions ($9.66 billion) is three businesses stacked on the same client base of banks and credit unions. Digital Payments runs debit processing and owns the Accel, STAR and MoneyPass debit networks, which are open to all US issuers and merchants [8]. Issuing processes credit, prepaid and government-disbursement card programs. Banking runs the account-processing systems on which a depository institution's deposit and loan ledgers, general ledger and customer files actually live — the DNA, Finxact, Premier, CoreAdvance, Portico and Signature cores [9].
Two sentences for a cold reader: Fiserv is the outsourced transaction factory for American finance — it runs the core software inside thousands of banks and credit unions and simultaneously acquires the card volume of millions of merchants, charging per account and per transaction under long contracts. Roughly 84% of revenue is earned in the US and Canada [10], and the business is currently in a revenue and margin stumble that began in 2025.
Scale and trajectory
Sources: FY2025 annual report, Item 1 revenue table for 2023–2025 [11]; FY2023 Form 10-K, Item 1 revenue table for 2021–2022 [12].
Revenue compounded at 6.9% a year from FY2021 to FY2025 ($16,226 million to $21,193 million). That run ended in the first quarter of 2026: adjusted revenue fell 2% year over year [13]. Organic revenue fell 3.6% [14], against full-year 2026 guidance of 1% to 3% organic growth [15]. The deterministic feature file records zero consecutive years of revenue decline and no three-year high-single-digit decline, so the framework's structural-decline disqualifier is not triggered on filed annual data; whether the 2026 stumble is the start of one belongs to Durability.
Segment economics
Source: FY2025 Form 10-K, Note 19 Business Segment Information, FY2025 and FY2024 columns [16] and the FY2023 column from the same note's prior-year table [17]. Operating margin computed as segment operating income divided by segment revenue; Corporate and Other carries unallocated costs and acquisition-intangible amortisation and has no meaningful margin.
The two segments earn very different money. Financial Solutions produced $4,380 million of segment operating income on $9,664 million of revenue — a 45.3% margin, 46% of company revenue and 56% of the two segments' combined operating income — while Merchant Solutions produced $3,502 million on $10,140 million, 48% of revenue at a 34.5% margin [18]. Corporate and Other absorbed a $2,064 million operating loss, most of it amortisation of acquisition-related intangibles, which is why consolidated operating income was $5,818 million rather than the $7,882 million the segments report [19]. The filing does not attribute that amortisation by transaction; the 2019 First Data merger is the only deal on the scale involved. The segment labels changed in FY2025: the three-segment structure of Acceptance, Fintech and Payments used through FY2023 [20] was consolidated into today's two, so pre-2023 segment series are not comparable.
Geography
International revenue was 16% of the FY2025 total, up from 15% in 2024 and 2023 [21]. Long-lived assets outside the US, excluding goodwill and intangibles, were about 21% of the consolidated total at 31 December 2025 against 19% a year earlier [22]. Management names the Euro, British Pound, Indian Rupee, Brazilian Real and Argentine Peso as the currencies whose movements matter, and states that the majority of revenue is earned in the US [23].
The Universe Screen
Both universe tests clear, and the listing is worth a sentence because it changed recently. Fiserv's common stock trades on the Nasdaq Global Select Market under the ticker FISV; on 11 November 2025 the company moved the listing to Nasdaq from the New York Stock Exchange, where it had traded as FI [24]. The common stock and seven series of senior notes are registered under Section 12(b) and listed on Nasdaq [25]. This is a Wisconsin-incorporated US issuer with a US primary listing — not an ADR, not a Chinese issuer.
On size, the feature file computes a market capitalisation of $30,562.8 million: 549.0 million shares outstanding at the FY2025 balance-sheet date times the $55.67 close on 29 July 2026. That is roughly three times the $10 billion floor. A same-week external check on 30 July 2026 shows the stock at $54.07 and a market capitalisation near $28.8 billion — the same order, still comfortably above the line. The recent history matters for how much cushion there is: the shares peaked at $237.79 on 3 March 2025 and troughed at $47.18 on 22 June 2026, an 80.2% drawdown, so the company entered this window at roughly $130 billion of market value and would need to fall a further two-thirds from here to approach the threshold. Even at the trough the same share count implies about $25.9 billion, still well clear of the bar. The anatomy of that decline is Dislocation's subject.
Sources: market capitalisation, share count, price and drawdown figures derived from data/ruchir/fit_features.json (market cap and capitulation gauge). The 30 July 2026 cross-check is third-party market data (stockanalysis.com, accessed 31 July 2026) and sits outside the filing corpus, so it carries no page citation.
Market Structure — Two Businesses, Two Structures
This is the P1 raw material, and it does not resolve to a single answer. Fiserv's own Item 1 says the market for its products and services "is fragmented, highly competitive, and served by a multitude of large and small businesses" [26]. That sentence is accurate for one half of the company and misleading for the other.
Source: Fiserv 2026 Investor Day, "Significant Headroom to Continue Our Growth" [27]. Shares are the company's own estimates using a proprietary methodology combining internal client data with external sources.
Financial Solutions is an oligopoly. The clearest evidence comes from a competitor's filing rather than Fiserv's: Jack Henry tells its own shareholders that its core solutions "compete with large vendors that provide information and transaction processing solutions to banks and credit unions, including Fidelity National Information Services, Inc.; Fiserv, Inc.; Corelation, Inc.; and Finastra" [28]. Four named vendors is the entire competitive set for US bank core processing. Fiserv puts its own share of US banking at 25% and of US issuer processing at 35% [29], serves more than 3,500 financial institutions from a $2.4 billion banking business, and claims the number one position in US core and digital [30]. Switching a bank's core is a multi-year migration of the institution's system of record, which is why these contracts renew.
Merchant Solutions is fragmented. Global Payments' 10-K lists its US merchant-acquiring competitors as, among others, Fiserv, Chase Paymentech, Elavon, Bank of America Merchant Services, Wells Fargo Merchant Services, Toast, Stripe, Shopify and Block [31] — nine named rivals and an explicit "large number of providers". Fiserv's own share estimates in that market are single-digit: 7% of US SMB, 7% of US enterprise, 4% of global SMB, 2% of global enterprise [32].
The two share numbers that look contradictory — 35% of US gross payment volume [33] against a 7% share of the US SMB merchant market [34] — are measured on different bases and both are Fiserv's own figures. The first is dollar volume flowing across its processing rails; the second is revenue share of an addressable market. The gap is the distribution chain: Fiserv reaches merchants through more than 1,000 bank partners, more than 3,000 independent sales organisations and roughly 2,000 independent software vendors, and those partners, not Fiserv, own much of the merchant economics [35]. Volume leadership and revenue-share leadership are not the same asset.
At the volume level the merchant franchise is genuinely first: $4.6 trillion of annual global merchant gross payment volume, 35% of US gross payment volume, 300 billion-plus transactions a year, 1.8 billion issuer accounts on file, and more than 6,000 financial institution clients [36]. Fiserv puts platform uptime at 99.999%-plus [37]. Fiserv states Clover is the largest single SMB franchise in the market by gross payment volume, ahead of the three unnamed peers it charts [38].
The counter-fact sits inside the oligopoly, not the fragmented half. In the first quarter of 2026, Financial Solutions organic revenue fell 6%, with Banking down 6%, Issuing down 6% and Digital Payments down 5% [39], while Merchant Solutions organic revenue fell only 1% [40]. The structurally protected segment is the one shrinking fastest. Whether that is price, mix, elevated core attrition or a lost contract cohort is Durability's question, but a market-structure argument that stops at "four vendors" without confronting a 6% organic decline in the same quarter is incomplete.
Regulatory perimeter
The entry barrier is real in banking and thin in acquiring. Because Fiserv serves regulated depository institutions, it is a significant service provider under the Bank Service Company Act and is directly examined by the Federal Reserve Board, the FDIC and the OCC under uniform FFIEC standards [41]. Subsidiaries hold payment-institution and electronic-money licences, a Merchant Acquirer Limited Purpose Bank charter regulated by the Georgia Department of Banking and Finance, and trust companies supervised in New Hampshire and Colorado; several subsidiaries are registered service providers or direct members of Visa and Mastercard [42]. A bank does not hand its system of record to an unexamined vendor, and that is a genuine gate. It is not a gate against Stripe, Toast or Shopify signing merchants — the same regime that protects the Banking franchise leaves the acquiring franchise open, which is exactly what Global Payments' competitor list shows [43].
Capital intensity and operating history
Capital intensity is moderate, not heavy. FY2025 capital expenditure including capitalised software was $1,763 million on $21,193 million of revenue, or 8.3%, split $570 million Merchant, $682 million Financial and $511 million Corporate; depreciation and amortisation ran $3,207 million, of which $2,027 million sat in Corporate and Other and is primarily acquisition-intangible amortisation [44]. Guidance holds 2026 capex at a high-single-digit percentage of revenue [45]. This is not the capital-heavy essential that survives on asset weight; the defensive asset is integration and switching cost, which is a different and more contestable thing.
On tenure, Fiserv cites more than 40 years of operating in highly governed environments [46], and the run's own price series carries daily closes back to January 1990 — an operating and listed history in the 30-to-50-year band the framework looks for. Management sizes the two addressable markets at roughly $290 billion for Merchant Solutions and roughly $140 billion for Financial Solutions on its own proprietary methodology [47]; those are company estimates, not independent ones, and should be read as such.
First-Pass Exclusion Screen
Auto exposure (X1)
Fiserv builds no vehicles and sells nothing to vehicle manufacturers as a disclosed line of business. Its segments are merchant acquiring and financial-institution processing [48]; no automotive OEM concentration appears anywhere in the FY2025 Form 10-K. The nearest adjacency is processing volume rather than manufacturing: $0.4 trillion of the $4.6 trillion of annual gross payment volume sits in a cash advance, fleet and EBT bucket that carries fuel-card spend [49]. The car-company exclusion does not apply.
Consensus positioning (X4)
Source: market capitalisations computed as shares outstanding times the 29 July 2026 close from the run's price and financial data; revenue as reported in each company's latest annual report. Three definitional cautions: Global Payments' $7,706 million excludes the Issuer Solutions business now presented as discontinued operations — adding its $2,510 million puts the ratio at 2.09x, still above Fiserv's; Block's reported revenue includes gross bitcoin revenue, which flatters its ratio downward; Jack Henry's fiscal year ends in June. Fiserv's own revenue is cited at [50]; Fiserv's FY2025 diluted EPS of $6.34, used for the trailing multiple below, comes from the same reported financials.
Fiserv is the cheapest name in its own peer set on sales, at 1.44 times FY2025 revenue against 2.1x to 5.0x for the four comparables — and the closest structural analogue in core banking, Jack Henry, trades at 3.4 times Fiserv's multiple. On earnings the gap is wider: $55.67 against FY2025 diluted EPS of $6.34 is 8.8 times trailing earnings, and against the $8.00–$8.30 adjusted-EPS guidance for 2026 it is roughly 6.8 times forward [51].
Coverage tone matches the multiple. As of 30 July 2026 the sell-side consensus rating is Hold, with an average twelve-month target of $66.85 against a $54.07 close; Cantor Fitzgerald cut its target to $53 from $62 in July 2026 while keeping a Neutral rating. Nobody is defending a story here.
Source: third-party market data (stockanalysis.com, accessed 31 July 2026) for the consensus rating, average twelve-month target and 30 July 2026 close; the Cantor Fitzgerald revision from July 2026 broker coverage. Neither is in the filing corpus and neither is page-citable.
Source: daily closing price series from the run's price data; 2026 is the 29 July 2026 close, not a year-end. Drawdown dates and depth from the deterministic feature file (capitulation gauge).
The chart shape settles the last part of the darling test. From 1990 to the end of 2024 this was a textbook bottom-left-to-top-right compounder — $0.68 to $205.42. Then it broke: peak $237.79 on 3 March 2025, trough $47.18 on 22 June 2026, an 80.2% decline over 476 days, with peak-leg volume running 7.4 times the pre-peak median. On multiple-to-sales, on coverage tone and on chart shape, the consensus-saturated-darling exclusion does not bite. The honest qualification is that it would have bitten squarely eighteen months ago — this is a former darling that de-rated, not a business consensus never loved, and the difference matters for how much of the old shareholder base is still anchored to the old price. That is Dislocation's ground.
China dependence (S1)
Fiserv discloses no China revenue and no China assets. International revenue is 16% of the total and international long-lived assets 21% [52] [53], and the currencies management identifies as material to results are the Euro, British Pound, Indian Rupee, Brazilian Real and Argentine Peso — the renminbi is not among them [54]. China appears in the FY2025 Form 10-K only as one of several jurisdictions with data-localisation requirements, alongside the EU, Argentina, Uruguay, Brazil, India and the UAE [55]. The stated caveat: this is an argument from absence of disclosure rather than a disclosed zero, since no segment or geographic note breaks out China. Given a 16% international revenue share spread across EMEA, LATAM and APAC, any China dependence is bounded well inside single digits.
Facts belonging to other tabs
Two items surfaced here that other briefs own and that should not be softened by being out of place. Fiserv has never paid a dividend and does not anticipate paying one [56], so the dividend-safety pattern does not apply; capital return runs entirely through repurchases, and 45.9 million shares remained under the February 2025 authorisation at year end after 3.05 million shares were bought in the fourth quarter at an average near $65 [57] — Self-Help's material. And the acquisition cadence is heavy: eight businesses bought during 2025 for $856 million plus $442 million to buy out minority partners in AIB Merchant Services and ICICI Merchant Services [58], which bears directly on the adjusted-cash-flow arithmetic in Yield. Separately, Wells Fargo declined to renew the Wells Fargo Merchant Services alliance, which expired on 1 April 2025 and returned $453 million of cash while converting a joint venture into a processing contract [59] — a data point for the durability of bank distribution.
Bottom line
Fiserv fell 80.2% from a $237.79 close on 3 March 2025 to $47.18 on 22 June 2026, and trades at $55.67. Five single trading days carried a compounded 70.7 points of that fall. The largest, 29 October 2025, took the stock down 44.0% on 41x normal volume as management cut 2025 adjusted EPS guidance from $10.15–$10.30 to $8.50–$8.60 [1]. Traded volume peaked at 7.39x the pre-fall median.
The drawdown
Peak close, 3 Mar 2025
Trough close, 22 Jun 2026
Current, 29 Jul 2026
Peak to trough
Days peak to trough
Source: fit_features.capitulation_gauge.drawdown, derived from the daily price series; 476 is calendar days, equal to 327 trading days. Peak and trough are closing prices.
The fall ran 16 months and did not arrive as one shock. Six weeks of quiet drift preceded the first event; four dated events then delivered the bulk of the decline; a fifth, eight months later, made the low. From the 22 June 2026 trough the stock has recovered 18.0%, so the current price is not the point of maximum fear — it is 76.6% below the peak and 18.0% above the bottom.
Source: daily closing prices from the run price series; month-end values. The 29 October 2025 guidance reset sits inside the October 2025 point [2].
The trigger
The identifiable, dated event is the third-quarter 2025 release of 29 October 2025. Fiserv reported adjusted EPS of $2.04 against a consensus of $2.65 and revenue of $4,919 million against $5,349 million, then reset the year: organic revenue growth of 3.5% to 4% and adjusted EPS of $8.50 to $8.60, from approximately 10% and $10.15 to $10.30 three months earlier [3] [4]. On the call, the CEO said that "Fiserv's growth and margin targets need to be reset," attributing the change to four factors: slowing cyclical growth in Argentina, the recalibration of optimistic growth assumptions in the original guidance, the impact of deferred investments, and the deprioritisation of short-term revenue and expense initiatives. He also said the analysis found "nothing at Fiserv is fundamentally broken" [5]. The same release announced two co-presidents, a new CFO effective 31 October, and three new directors [6].
The market reaction that day was the largest one-day decline in Fiserv's listed history back to 1990: minus 44.0%, on 103.5 million shares. The next day added minus 7.7% on 63.8 million.
Sources: closes and volumes from the daily price series; volume multiples against the 2.50 million-share median of the 180 days before the peak. Events per the Q1 2025 release [7], the Q2 2025 release [8], the Q3 2025 release [9] and the 8-K reporting the CEO change [10]. The 15 May 2025 conference remarks were not filed on an 8-K and are attributed to contemporaneous press reports.
Compounded, those five days multiply to a 70.7% decline: $237.79 becomes $69.74. Every other trading day in the 16 months — 349 of them — accounts for the remaining minus 20.2% that takes the price to $55.67. Three of the six worst days in the company's entire price history back to 1990 fall inside this drawdown.
Two of the five were not earnings releases, and one of them rests on no filing at all. On 15 May 2025 the then-CFO said at an investor conference that Clover volume growth would be broadly similar to the first quarter, where Clover revenue had grown 27% on annualised payment volume growth of 8% [11]; the stock fell 16.2% that day. On 15 June 2026 the company disclosed that the CEO of 13 months had resigned on 12 June, with a successor appointed two days later [12]; the company's leadership-transition release the same day said he was leaving to become chief executive of another company. The stock fell 10.9% and made its low a week later.
Drift before the event
The first move down was drift, not a repricing. From the 3 March 2025 peak to 23 April 2025 the stock fell 8.7%, on median daily volume of 3.40 million shares — 1.36x the pre-peak median. That span includes the 4 April 2025 market-wide decline of 8.4%, which was not company-specific. Nothing in the corpus dates a Fiserv disclosure to that window, and the company affirmed its 10% to 12% organic growth and $10.10 to $10.30 adjusted EPS outlook on 24 April [13] — the same outlook it had set on 5 February [14]. The 18.5% fall on 24 April came with that affirmation intact: what changed was the composition of growth, not the headline number. The pattern repeated in July, when Fiserv reported adjusted EPS of $2.47 against a $2.43 consensus, raised the low end of its EPS range to $10.15, and still fell 13.8% — Clover revenue grew 30% on reported volume growth of 8%, 11% excluding the prior-year gateway conversion, and management promised a second-half acceleration [15] [16].
So the event leg separates cleanly from the drift: an 8.7% orderly slide on normal volume, then four disclosure-driven days on 6.8x to 41.4x volume that did the work.
The fear gauge
The measured spike is 7.39x: the maximum 20-day average volume in the peak-to-trough leg divided by the median daily volume of the 180 days before the peak. That maximum window ended 25 November 2025 — it is the four weeks that begin with the 29 October reset. Inside it, 369.2 million shares changed hands, equal to 67.2% of the 549 million shares outstanding, in 20 trading days. The single day of 29 October traded 41.4x the pre-peak median and stands as the largest volume anomaly in Fiserv's price history relative to its own 50-day average.
Source: daily volumes from the run price series, divided by the 2,496,382-share median of the 180 calendar days before the 3 March 2025 peak; the same denominator used by fit_features.capitulation_gauge.volume_spike. July 2026 excludes a partial final session.
Two readings follow, and they pull in different directions. The spike is genuinely emotional in shape: it arrived on a single disclosure, at a point where the stock had already fallen 47% from the peak, and it turned two-thirds of the register in a month — the profile of holders exiting on the news rather than on the arithmetic. Against that, volume has never gone back to normal. Every month since April 2025 has run between 1.7x and 4.9x the pre-fall median, and the most recent month is still 2.4x. A capitulation that exhausts itself leaves quiet behind it; 15 months of doubled turnover reads more like a continuing transfer of the register than a single flush. The June 2026 low came on a second, smaller spike of 10.7x, eight months after the first.
Who was selling
The disclosed record identifies one large seller, two large buyers, and no forced seller.
Sources: the 2025 proxy statement ownership table as of 28 February 2025 [17]; the 2026 proxy statement ownership table as of 27 February 2026 [18]; Schedule 13G/A filings by T. Rowe Price dated 14 August 2025 and by Dodge and Cox dated 13 November 2025 and 13 February 2026, staged under data/ownership_by_owner/.
The seller. T. Rowe Price held 35,160,318 shares, 6.3% of the class, at 28 February 2025 [19]. Its Schedule 13G/A reporting 30 June 2025 shows 18,707,183 shares, 3.4% — 16.5 million shares sold, 46.8% of the position, in four months. That selling happened during the April and May legs and before the October reset, and because it crossed below 5% the firm has no further disclosure obligation, so the eventual size of the exit is unknown. It does not appear in the 2026 proxy's 5% table [20].
The buyers. Dodge and Cox went from 34,866,570 shares at 28 February 2025 to 38,634,009 at 30 September 2025 and 49,474,622 at 31 December 2025 — an addition of 10.8 million shares, 28.1% of the position, in the quarter containing the crash. Vanguard rose from 50,085,002 shares to 63,408,549 over the year; some of that percentage gain is mechanical, since shares outstanding fell from 558,574,211 at the 17 March 2025 record date [21] to 533,948,657 at 27 February 2026 [22]. BlackRock's disclosed holding is the identical 39,890,598 shares in both proxies, which means the same underlying report was carried forward; it carries no information about flows.
Insiders. Two executives sold into the top: the COO sold 45,000 shares for $10.6 million on 20 February 2025 at $235 to $236, and the head of the financial institutions group sold 13,560 shares for $3.2 million at $238.15 on 3 March 2025, the peak day itself. No insider has made an open-market sale since 28 May 2025. Buying then ran the other way, in three clusters: a director bought $651,800 at $65.18 on 30 October 2025, the day after the crash; the new CFO bought $1,060,970 at $62.41 on 1 December and the chief legal officer $499,201 at $63.19 on 2 December 2025; and six insiders including the CFO bought $1,723,401 between $48.41 and $50.59 on 16 and 17 June 2026, days after the CEO resignation and days before the low. The total is $3.94 million bought against $13.8 million sold before the fall — small against a $30.6 billion market value, but directionally unambiguous and made at prices that have since held.
Forced and structural sellers. None is documented. The exchange move was voluntary: on 28 October 2025 Fiserv notified the NYSE that it would withdraw its listing and transfer to Nasdaq effective on or about 11 November 2025 [23], which does not affect its S&P 500 membership and produces no index-mandated selling. No index deletion, fund liquidation or margin event appears in the corpus or in the web record. Short interest is not a factor on any available read: the official FINRA series returned no rows for this ticker, and third-party trackers put the position near 20.6 million shares, 3.9% of shares outstanding, against 23.2 million the prior month — a level that neither drove the fall nor sets up a squeeze. An activist, Jana Partners, disclosed a roughly 2.2 million-share position in February 2026, about 0.4% of the register.
Set against the buyers is a live overhang. Three federal securities class actions are pending, the first covering purchasers from 22 July 2024 to 24 July 2025, with lead plaintiffs appointed in November 2025, the others covering 23 July 2025 to at latest 29 October 2025; all allege that statements about Clover's growth were false or misleading [24]. That is a reason for some institutional holders to stay out that has nothing to do with the operating arithmetic.
Estimates against price
The forward earnings base and the price did not move together. Measured from the peak, the near-term guidance fell 16.2% while the price fell 70.3%.
Sources: the guidance midpoints as published on 5 February 2025 [25], 24 April 2025 [26], 23 July 2025 [27], 29 October 2025 [28] and 10 February 2026 [29]; the final bar is the 2026 guidance midpoint. Closes from the daily price series.
The sequence has three phases.
Between 3 March and 23 July 2025 the price fell 39.9%, from $237.79 to $143.00, while the company's own adjusted EPS guidance midpoint went from $10.20 to $10.225 — it rose. The price moved roughly six months and 40 points ahead of any published cut.
On 29 October 2025 the two converged in a single session. Consensus for the quarter had stood at $2.65 of adjusted EPS and $5,349 million of revenue; the reported figures were $2.04 and $4,919 million, misses of 22.9% and 8.0%. The full-year guidance midpoint moved from $10.225 to $8.55, a cut of 16.4%; the stock fell 44.0% the same day. That is the only day on which the estimate cut and the price cut arrived together.
Since then the price has fallen again with the estimates roughly still. Over the six months from 31 January 2026, consensus normalised EPS for FY2027 moved from $9.15 to $8.93, minus 2.3%, and for FY2028 from $9.75 to $10.02, plus 2.8%; consensus revenue for both years moved less than 1%. The price over the same window fell from $63.73 to $55.67, minus 12.6%, touching minus 26.0% at the June low.
Put through the multiple, the whole 16 months decomposes exactly. At the peak, $237.79 against the then-guided FY2025 adjusted EPS midpoint of $10.20 is 23.3 times. Today, $55.67 against the FY2026 consensus of $8.12 is 6.9 times. The forward earnings base is down 20.4%; the multiple is down 70.6%; and 0.796 times 0.294 is 0.234, which is the 76.6% peak-to-current fall. Roughly four-fifths of the decline is re-rating, one-fifth is the earnings cut itself.
The strongest fact against reading that as anchoring to a one-year number is the shape of the consensus curve beyond it. This was not framed as a single bad year: the medium-term organic growth target of 9% to 12% was withdrawn with the guidance [30], FY2025 adjusted EPS came in at $8.64 against $8.80 the prior year — a decline, not a pause [31] — and 2026 was guided to 1% to 3% organic growth and $8.00 to $8.30 of adjusted EPS [32], a second consecutive decline. Consensus normalised EPS does not regain the $10.20 that was guided for FY2025 by FY2028, where it sits at $10.02. The sell side is modelling three-plus years to get back to the starting line, not one.
Consensus forward free cash flow tells a steadier story than consensus EPS. On the current market value of $30.6 billion, the consensus mean stands at $3.88 billion for FY2026, $4.28 billion for FY2027 and $4.68 billion for FY2028 — rising, not falling, across the forecast horizon. What those figures imply against the framework's yield reference lines belongs to Yield; what the earnings cut did to intrinsic value, and whether it is temporary, belongs to Damage Math.
What this does not settle
The drawdown is fully dated and the trigger is a filed document, but three things sit outside what the record here can answer.
Reported short interest is unavailable from the official source for this ticker — the FINRA feed staged for this run returned no position rows, plausibly a consequence of the November 2025 ticker change from FI to FISV — so no through-the-fall series can be shown, only a current third-party level near 3.9% of shares outstanding, and two trackers disagree on it by a third. Institutional flow is visible only at the 5% disclosure threshold and at proxy dates, which means the middle of the register, where most of the 2.5 billion shares traded since the peak actually moved, is not observable. And one of the five decisive days rests on unfiled oral remarks at an investor conference rather than on a document, so the mechanism of that leg is attributed to contemporaneous reporting rather than to a primary filing.
The damage and the price
Fiserv's FY2025 adjusted-EPS guidance was cut 16.4% on 29 October 2025 — $10.225 to $8.55 at the midpoint [1] [2]. Market value fell $101.3 billion from the March 2025 peak to 29 July 2026. Capitalised conservatively, the cash the reset removed is worth $3.4bn to $50.7bn. The gap is real and large. The trial put the probability the impairment is temporary at 0.61, and called the result contested.
The near-term hit, quantified
The numerator of this tab is a guidance path, not a modelled estimate. Fiserv guided fiscal 2025 four times, and the four numbers are dated and filed.
Sources: FY2025 outlook as first guided at 10% to 12% and $10.10 to $10.30, 5 Feb 2025 [3]; outlook refined, 23 Jul 2025 [4]; outlook reset to 3.5% to 4% and $8.50 to $8.60, 29 Oct 2025 [5]; FY2026 outlook of 1% to 3% and $8.00 to $8.30, 10 Feb 2026 [6], with the FY2025 adjusted earnings per share of $8.64 [7]. Bars show guidance midpoints; FY2025 actual as reported.
On 5 February 2025 the company guided 2025 organic revenue growth of 10% to 12% and adjusted EPS of $10.10 to $10.30 [8]. On 23 July it refined that to approximately 10% and $10.15 to $10.30 [9]. On 29 October it cut to 3.5% to 4% and $8.50 to $8.60 [10]. Management framed it as a level change rather than a quarter: "Fiserv's growth and margin targets need to be reset," driven by four named factors — slowing cyclical growth in Argentina, recalibration of optimistic growth assumptions, the impact of deferred investments, and deprioritisation of short-term revenue and expense initiatives [11]. Fiscal 2025 then landed at $8.64, above the reset range [12], and fiscal 2026 was guided to 1% to 3% organic and $8.00 to $8.30 [13].
Two hit sizes follow, and they differ:
- Against the guidance in force, the reset removed $1.675 of adjusted EPS from fiscal 2025, a 16.4% cut.
- Against realised earning power, adjusted EPS went $8.80 (FY2024) to $8.64 (FY2025) to $8.15 guided (FY2026) — down 7.4% over two years [14].
Cash fell further than earnings. Company-defined free cash flow went $5,233m in 2024 to $4,435m in 2025 — down 15.3% [15] — and consensus carries $3,880m for 2026, 25.9% below the 2024 level (data/sp/estimates.json, vintage 30 July 2026). Any account of this drawdown that quotes only the 7% EPS decline understates what happened to cash.
The consensus record at the moment of the event is the sharpest single reading. On the Q3 2025 print, adjusted EPS came in at $2.04 against a consensus of $2.646 — a 22.9% miss — and revenue at $4,919m against $5,348m, an 8.0% miss (data/sp/estimates.json:beat_miss). Since the reset, the direction has changed: FY2027 consensus EPS has drifted from $9.15 (31 Jan 2026) to $8.93 now, down 2.3%, while FY2028 has risen from $9.75 to $10.02, up 2.8% (data/sp/estimates.json:momentum). The vendor's revision history in this run begins on 31 January 2026 and covers only FY2027 and FY2028, so there is no pre-trigger consensus vintage for FY2026 to cite; the guidance path above is the primary-document substitute.
Price and enterprise value
Source: daily closing prices, data/prices/daily.json; peak, trough and current dates per fit_features.capitulation_gauge.
The reset day itself: the shares closed at $126.17 on 28 October 2025 and $70.60 on 29 October, on 103.5 million shares against 5.8 million the session before. On the 537,851,887 shares outstanding at 24 October 2025 [16], market value went from $67.86bn to $37.97bn — $29.89 billion in one session. The same day's guidance cut removed $1.675 of adjusted EPS, or about $901m of annual adjusted earnings at that share count. The one-day loss of market value is 33 times the annual earnings amount withdrawn. The volume anatomy of that session and the two legs around it sit in Dislocation.
The peak-to-current move on the whole enterprise:
Peak market cap: 554,433,824 shares at 18 Apr 2025 [17] times the $237.79 peak close. Current market cap from fit_features.market_cap (549.0m shares, $55.67, 29 Jul 2026). Net debt: total debt of $1,239m current plus $27,758m long-term at 31 Dec 2025, less $798m cash [18] [19]; prior-year comparatives $1,110m and $23,730m from the same debt note, and $1,236m of prior-year cash from the consolidated balance sheet [20].
Equity value fell $101.3 billion, or 76.8%. Enterprise value fell $96.7 billion, or 62.2%. The difference matters: net debt rose $4.6 billion over the window, and equity is now 52% of enterprise value, so a given percentage move in operating value arrives at the equity magnified. Comparing the equity fall with an equity-level NPV estimate is the consistent pairing, and that is what follows — but the leverage is the reason the equity number is the larger one.
Two further readings sit inside the phase table. First, the largest single leg — $237.79 to $126.17, down 46.9% — happened entirely before any guidance change, with the fiscal-2025 range still at $10.15 to $10.30. That leg is a multiple compression from 23.3 times the guidance in force to 12.3 times, on unchanged numbers. Second, the 21.1% decline since the reset has run against a fiscal 2025 that beat the reset range, a fiscal 2026 guide reaffirmed in February and May, and a Q1 2026 adjusted EPS that beat consensus by 13.5% (data/sp/estimates.json:beat_miss). Of the 76.6% total price decline, the portion coincident with the earnings damage is the 44.0% reset day.
The NPV arithmetic
The question is how much of the present value of future cash the reset plausibly destroyed. The workings below are deliberately simple and fully visible.
Assumptions, stated. Cash flow measure: company-defined free cash flow, which is levered (operating cash flow is after interest), so it discounts to equity value and pairs with market capitalisation. Discount rate: 9% on equity, with 8% and 10% shown as sensitivities. Terminal growth in the permanent case: 3%. No terminal-value modelling of the business itself — only of the shortfall, which is what the event changed.
Step 1 — size the annual cash shortfall. Two anchors, because the answer depends on what counts as "before":
- Anchor A, realised. FY2024 free cash flow of $5,233m less FY2026 consensus free cash flow of $3,880m = $1,353m a year [21].
- Anchor B, the withdrawn algorithm. The February 2025 guidance implied adjusted EPS growth of 15% to 17% [22]. Compounding FY2024's $5,233m at 15% for two years, holding conversion constant, gives a FY2026 path of $6,921m. Less the $3,880m consensus = $3,041m a year. This anchor capitalises growth management has since withdrawn, so it is the version most favourable to the permanent reading.
Step 2 — capitalise each anchor two ways. Temporary: the shortfall runs three years and then the prior cash level is restored, so the damage is a three-year annuity. Permanent: the shortfall never reverses and grows at 3%, so the damage is shortfall divided by (9% − 3%), a 16.7 times multiple.
Derived: shortfall times the 9% present-value annuity factor (2.531 for three years, 3.890 for five) for the temporary cases, and shortfall divided by 0.06 for the permanent case. Inputs are the FY2024 and FY2025 free-cash-flow reconciliation [23] and FY2026 consensus free cash flow from the vendor estimates file.
Step 3 — the gap.
Derived from the tables above: price damage from the enterprise-value bridge; NPV damage from the two-anchor grid at a 9% discount rate.
Against the most damaging cell in the grid — a permanent level shift measured against the withdrawn growth algorithm, $50.7bn — the equity price damage of $101.3bn is $50.6 billion larger, a ratio of 2.0 to 1. Against the more defensible permanent case anchored on realised FY2024 cash, $22.6bn, the gap is $78.7 billion, a ratio of 4.5 to 1. The temporary cases leave gaps of $93.6bn to $97.8bn.
Discount rate does not close it. At 8% the permanent anchor-B damage is $60.8bn (gap $40.5bn); at 10% it is $43.4bn (gap $57.8bn). Closing the gap entirely on the anchor-B shortfall requires capitalising $3.04bn a year at 33 times — a spread between discount rate and growth of 3.0%, for example 9% and 6% in perpetuity. On anchor A it requires 75 times.
The same arithmetic run backwards gives the plainest version. At $55.67 the equity is worth $30.56bn (fit_features.market_cap). Discounted at 9% with no growth, that price implies sustainable free cash flow of $2.75bn a year — 29% below the FY2026 consensus of $3.88bn and 38% below the $4,435m Fiserv actually generated in 2025 [24]. At 3% growth the implied figure falls to $1.83bn, 53% below the 2026 consensus. The yield side of that computation is worked in Yield.
Three qualifications belong next to the gap. The peak multiple of 23 times was set on guidance that management later attributed in part to an Argentine inflation windfall — organic growth excluding Argentina was roughly 6% in FY2023, 6% in FY2024 and 3% year-to-date 2025, against headline rates of 12%, 16% and 5% [25] — so part of the "value" the price gave up was never underwritten by durable cash. That is why both anchors here start from realised free cash flow rather than from the peak market value. Second, the fit_features market capitalisation uses 549.0 million shares; the most recent filed count is 533,253,986 at 1 May 2026 [26] and 2026 guidance assumes a weighted average of approximately 530 million [27], which would put market value at $29.5bn and widen the gap slightly. Third, fit_features cannot compute the framework's adjusted free cash flow at all — stock-based compensation is missing from the cash-flow feed for every year from 2018 to 2025 — so the cash figures here are company-defined free cash flow, not FCF less SBC less average acquisition spend.
Temporary or permanent
The temporary-versus-permanent question was argued by two opposing briefs, each restricted to corpus citations, and ruled on by three judges reading in different orders.
Sources — temporary: adjusted EPS reconciliation [28]; Argentina contribution [29]; One Fiserv investment step [30]; Project Elevate [31]; second-half bridge [32]; trough and Q1 detail [33]; FY2025 cash conversion [34]; 2029 profile [35]; the two post-reset beats from data/sp/estimates.json:beat_miss. Permanent: four causes [36]; ex-Argentina growth [37]; margin path [38] [39] [40]; Clover revenue expectations and the Q4 fee-elimination headwind [41] [42]; One Fiserv risk language [43]; Financial Solutions detail [44]; core survey [45]; Clover litigation [46].
The ruling
Source: ruchir/trial/tally.json, generated 31 July 2026. Panel figure is the recorded p_temporary; per-judge figures as filed.
The panel put the probability the impairment is temporary at 0.61, on a per-judge range of 0.38 to 0.62 — a spread of 0.24, with a simple mean of 0.54. The tally records the result as contested, and the reading order left a mark: the judge who read the temporary brief first landed at 0.62, while the two who read the permanent brief first averaged 0.495, a gap of 0.125. Both readings are live, and this tab does not pick between them.
The tally's own quote checks discipline both briefs. On the permanent side, the Investor Day core-satisfaction exhibit was recorded as discredited as used: the same slide that shows 2.59 for Fiserv-sold DNA also shows 4.03 for partner-sold DNA — the highest score in the survey, above both named peers, on the identical product — which points at a sales-channel failure rather than product decay [47]. On the temporary side, the brief's "two CEOs in 17 months" rebuttal was recorded as partly unsupported and chronologically reversed: Georgakopoulos was named co-president effective 1 December 2025, after the reset, and the Q1 2026 beat was reported on 5 May 2026, six weeks before he became chief executive. The tally also notes that the brief omitted the Jana Partners activist campaign and the departure of the chief executive who presented the 2029 targets one month after presenting them.
The named flip conditions on both sides converge on the same near dates: whether Q2 2026, reported 6 August 2026, is the trough; whether second-half 2026 adjusted revenue reaches the 6%-to-8% bridge rather than landing below 5%; whether free cash flow conversion holds near 90%; and whether FY2027 adjusted EPS guides above $8.30. The timing of those tests is worked in Clock.
Which line broke
Revenue did not break. Fiscal 2025 adjusted revenue was $19.8bn, up 4%, and consensus carries $20.0bn for 2026 — up 1.2% (data/sp/estimates.json). What broke is margin. Adjusted operating margin ran 39.4% in 2024 [48], fell 200 basis points to 37.4% in 2025 [49], and is guided to approximately 34% for 2026 [50]. Roughly 5.4 points of margin on about $20bn of revenue is about $1.08bn of operating income — the same order as the approximately $600m of people-related and $400m of technology investment the company sized and labelled "Fully in Place" [51].
Source: analyst driver consensus, data/sp/va.json, consensus vintage 24 July 2026; 12 to 20 contributing brokers per line. FY2025 figures are the consensus-recorded actuals.
Source: analyst driver consensus, data/sp/va.json, consensus vintage 24 July 2026; 16 to 19 contributing brokers per line on FY2025 to FY2027 and 9 to 10 on FY2028.
Financial Solutions is the segment that turned negative. Its organic growth goes from plus 1.6% in 2025 to minus 1.1% in 2026, and its operating margin from 45.6% to 41.0% — 455 basis points on about $9.6bn of revenue, roughly $436m. Merchant Solutions decelerates but does not invert: plus 6.1% to plus 3.3%, with margin down 312 basis points on about $10.5bn, roughly $327m. Inside Financial Solutions, Banking is the persistent negative — minus 2.9% in 2025, minus 2.0% in 2026 — and consensus has it recovering only to plus 1.6% in 2027. Inside Merchant, Processing has now run at about minus 4.2% for two consecutive years.
The mechanism that would self-correct. Three of the four components are level effects or dated comparisons rather than lost business. The One Fiserv spend is a one-time step into the cost base, sized and complete, against which the company sets approximately 34% as the leverage baseline [52]; Project Elevate then adds $500m-plus of run-rate cost reduction and 200 basis points-plus of margin by 2029 [53]. The single largest driver of the second-half 2026 revenue reacceleration is a plus-3.5% lapping of a non-recurring headwind — an expiry with a date, not a win [54]. And the Banking attrition is described by management as self-inflicted: it "is the result of actions taken over the last several years and especially around the client service front", with the decision to support all cores having "removed a significant amount of perceived pressure for them to switch" [55]. The core-satisfaction survey supports that reading rather than a product one: 4.03 for partner-sold Fiserv DNA against 2.59 for Fiserv-sold DNA, on the same core [56]. The medium-term plan asks Financial Solutions for only 2% to 4% growth, with total company 4% to 6% [57], and holds free cash flow conversion at approximately 90% with capital expenditure normalising from approximately 8.8% of adjusted revenue toward approximately 8% [58].
The structural case against. Banking organic revenue has been negative in both 2025 and 2026 consensus and returns only to plus 1.6% in 2027; Merchant Processing has been at about minus 4.2% for two years. Core account counts fell 2% year on year in Q1 2026 while overall accounts and positions including Finxact grew 6%, and Financial Solutions segment margin was 38.1% against 47.5% a year earlier [59]. The 10-K states that the expected benefits of the plan may not be achieved on the anticipated timeline "or at all" [60]; Standard and Poor's revised the corporate credit rating outlook from stable to negative on 5 November 2025 [61]; and a securities class action alleges that statements about Clover's growth were false or misleading over a July 2024 to July 2025 class period [62].
Two of the framework's exclusion tests bear on this evidence and neither is met at the company level. Total revenue is not in decline — fiscal 2025 adjusted revenue grew 4% and consensus carries growth in each of 2026, 2027 and 2028 — so the three-consecutive-years-of-high-single-digit-decline disqualifier does not apply, and the segment-level erosion in Banking and Merchant Processing is stated here as what it is: two lines shrinking inside a company that is not. The durability of the franchise on the longer clock is worked in Durability; the balance sheet that has to carry the reinvestment is in Self-Help.
The gap, restated
The near-term hit is real and measurable: a 16.4% cut to the guidance in force, a 7.4% decline in realised adjusted EPS from 2024 to the 2026 guide, and a 25.9% decline in free cash flow from 2024 to the 2026 consensus. Capitalised at 9%, the present value of that shortfall is $3.4bn if it is temporary and lasts three years, and $22.6bn to $50.7bn if it is permanent, depending on whether the pre-reset growth algorithm is treated as value that existed. The price took out $101.3bn of equity value and $96.7bn of enterprise value. The gap between price damage and the most damaging plausible NPV damage is $50.6 billion; against the central permanent case, $78.7 billion. Whether that gap is a mispricing or a correct reading of a franchise still eroding is the question the trial answered at 0.61 probability temporary, contested.
Bottom line
On the framework's basis — free cash flow less stock-based compensation less the five-year average of acquisition spend — Fiserv earned $3,408 million of adjusted FCF in FY2025, an 11.2% yield on today's $30.6 billion market capitalisation. The company's own six-year baseline was 3.1–4.3%. Net debt of $28.2 billion against $9.0 billion of EBITDA puts the name at 3.1x, straddling the line that separates the 10% bar from the 25% bar.
The adjustment, line by line
Fiserv's reported free cash flow overstates what an owner keeps for two reasons the framework corrects: roughly $357 million a year of share-based compensation is added back as a non-cash item in operating cash flow [1], and acquisition spend is a recurring capital cost for this company rather than an exceptional one — $17.9 billion across the seven years below [2][3].
Reported FCF = net cash from operating activities less capital expenditures; adjusted FCF = reported FCF − SBC − trailing five-fiscal-year average acquisition spend. Sources: FY2025 Form 10-K, Consolidated Statements of Cash Flows [4]; FY2024 [5]; FY2023 [6]; FY2022 [7]; FY2021 [8].
The FY2025 line reads: $6,062 million of operating cash flow less $1,763 million of capital expenditure gives $4,299 million reported; less $357 million of share-based compensation and less $534 million — the 2021–2025 average of $848m, $988m, $13m, nil and $820m — gives $3,408 million adjusted [9]. The adjustment removes $891 million, or 20.7% of the reported figure. Fiserv's own non-GAAP free cash flow for FY2025 was $4,435 million, $136 million above the operating-cash-flow-less-capex figure used here, the difference being severance, merger and integration payments added back, net of tax on those adjustments, distributions to non-controlling interests and other reconciling items [10]. This tab uses the unadjusted operating-cash-flow-less-capex definition throughout, which is the more conservative of the two.
Two features of the table carry more weight than the arithmetic itself.
The First Data merger dominates any window that contains 2019. Fiserv paid $15,083 million of cash for acquisitions that year [11], so the FY2023 five-year average is $3,414 million and adjusted FCF that year collapses to $18 million. Read literally, the framework's own formula says Fiserv generated no owner cash in 2023. Treated as the once-in-a-company-history transaction it was, the FY2023 average falls to $398 million and adjusted FCF to $3,034 million. Both readings appear below, labelled.
The FY2019–FY2022 rows carry no adjusted figure because their five-year acquisition windows reach into 2017 and 2018, which the corpus does not hold. Those four years therefore appear on the reported-FCF-less-SBC basis only, which is the basis used for the baseline series in the next section.
The deterministic feature file returns not_computable for adjusted FCF, adjusted yield, the yield baseline and FCF stability, because the structured financial feed carries no share-based-compensation or acquisitions line for any year (data/financials/cash_flow.json holds only the cash-flow subtotals, capex, net income and free cash flow), and for the balance-sheet class because data/financials/balance_sheet.json carries no debt line. Every figure in this tab is computed from the filed cash-flow statements instead, and the market capitalisation of $30,562.83 million (549.0 million shares at $55.67 on 29 July 2026) is taken from the feature file unchanged. The gap is a feed limitation, not a disclosure limitation — Fiserv discloses both lines in every year.
The yield, three ways
Adjusted yield, FY2025 basis
3-year average (as computed)
Own baseline, FY2019-24 median
Consensus FY2026, reported FCF
Derived from filed cash-flow statements [12] divided by market capitalisation per fit_features.market_cap; consensus per fit_features.consensus_forward_yield.
Current. $3,408 million of FY2025 adjusted FCF divided by $30,563 million of market capitalisation is 11.15%. On the market capitalisation implied by the 533,253,986 shares actually outstanding on 1 May 2026 [13] rather than the 549.0 million diluted weighted-average shares the feature file uses [14], the same numerator yields 11.48% — a 33 basis point understatement in the headline figure, in the conservative direction.
Three-year average. FY2023–FY2025 adjusted FCF of $18m, $4,297m and $3,408m averages $2,574 million, an 8.42% yield — 158 basis points below the 10% line. Substituting the ex-First-Data reading of FY2023 ($3,034 million) lifts the three-year average to $3,580 million and the yield to 11.71%. The entire gap between those two answers is the treatment of one 2019 transaction.
The company's own baseline. Measured on a consistent basis — reported FCF less SBC, divided by that fiscal year's own year-end market capitalisation — Fiserv's yield sat in a 3.05% to 4.30% band for six consecutive years before FY2025.
Numerator from each year's filed Consolidated Statements of Cash Flows [15][16][17]; denominator is that year's diluted weighted-average share count [18] times the last close on or before 31 December, per the feature file's stated method.
The median of the six pre-2025 years is 3.85%. The FY2025 year-end reading is 10.69%, and at $55.67 the same numerator yields 12.90%. On the fully adjusted numerator the current level is 11.15%, or 2.9 times the baseline median — past the 2x threshold the feature file uses to flag a jump. The shape is the fortress signature the framework looks for: a name that traded at a stable 3.5–4% yield for six years now trading near three times that. The balance sheet underneath it is not a fortress, which is the subject of the next section.
Which bar applies
Total debt is $1,239m short-term and current maturities plus $27,758m long-term [19]; cash of $798m from the balance sheet [20]; EBITDA is operating income of $5,818m [21] plus $3,207m of depreciation and amortisation — $1,857m of depreciation and other amortisation, $1,304m of acquisition-related intangible amortisation and $46m of financing-cost amortisation [22].
$28,199 million of net debt over $9,025 million of EBITDA is 3.12x. The framework's rule places a company in the levered class at 3.0x and above, and in the moderate class below it. Fiserv sits 12 basis points of ratio past the line, and the answer moves either side of it on ordinary definitional choices:
- Excluding finance lease and other financing obligations ($477m current, $1,635m long-term) from debt [23] gives net debt of $26,087 million and 2.89x.
- The consensus data set carries FY2025 net debt of $26,774 million against EBITDA of $9,255 million — 2.89x on the vendor's own definitions.
- Management's stated measure is gross debt to adjusted EBITDA: below 3.2x at 31 March 2026, with a stated expectation of approximately 3.0x at year-end 2026 and a standing long-term target of 2.5 to 3.0 times [24][25].
The company carries a Baa2 corporate credit rating from Moody's with a stable outlook and BBB from Standard and Poor's, whose outlook was revised from stable to negative on 5 November 2025 [26].
The read that follows from those figures: Fiserv belongs in the moderate class, against the 10% bar. Three of the four measures above land at 2.89–3.12x, clustered on the boundary rather than through it, and the capital structure is investment-grade with continuous access to the bond and commercial-paper markets — structurally unlike the framework's levered anchor, where a 25% bar was set against a company running well above 4x with no rating constraint. The counter-case is stated as plainly: on the filed balance sheet, taking all debt and all EBITDA as reported, the ratio is 3.12x and the rule says levered.
Both positions, in arithmetic:
- Against the 10% bar: 11.15% on FY2025 adjusted FCF is 115 basis points above. The three-year average as literally computed, 8.42%, is 158 basis points below; on the ex-First-Data reading, 11.71%, it is 171 basis points above.
- Against the 25% bar: 11.15% is 1,385 basis points short. No reading of the history or the forward estimates closes that gap.
- The 8–9% fortress line does not apply. Net debt of $28.2 billion is not a net-cash balance sheet.
At $30,563 million of market capitalisation and $3,408 million of adjusted FCF, retiring the entire equity would take 9.0 years of adjusted cash flow. Management's demonstrated repurchase habit and its current pace are the subject of Self-Help.
Normalized mid-cycle yield
Fiserv is not meaningfully cyclical. Revenue grew in every year of the seven shown and the drivers of the FY2025–FY2026 decline are company-specific — lower non-recurring data and analytics and licence revenue [27], higher payments to distribution partners, and higher personnel and data-processing costs [28]. There is no commodity or capacity cycle to normalise against.
There is, however, a conversion question worth normalising, because FY2024 and FY2025 sit at opposite ends of Fiserv's own cash-conversion range and the yield answer moves by 500 basis points across that range. The workings, stated so a skeptic can recompute under alternates:
Assumption 1 — the conversion band. Reported FCF as a percentage of GAAP revenue across FY2019–FY2025 was 20.4%, 21.9%, 17.7%, 17.7%, 19.8%, 24.7% and 20.3%. The seven-year mean is 20.4%; the low is 17.7% (FY2021 and FY2022, the post-merger integration years); the high is 24.7% (FY2024).
Assumption 2 — the revenue base. FY2025 GAAP revenue was $21,193 million [29]; management guides 1% to 3% adjusted revenue growth for 2026 [30]. The midpoint gives $21,617 million.
Assumption 3 — the deductions. SBC of $360 million (FY2025 was $357 million; Q1 2026 ran $118 million against $124 million a year earlier [31]) and a five-year average acquisition figure of $364 million, being the 2022–2026 window with 2026 assumed at nil — Q1 2026 acquisition spend was nil [32]. Total deduction $724 million.
Derived: FY2026 revenue of $21,617m times the stated conversion rate, less $724m of SBC and averaged acquisition spend, over market capitalisation of $30,563m. Conversion band from filed cash-flow and income statements, FY2019–FY2025 [33][34][35].
The mid-cycle answer is 12.06%, and the worst point of Fiserv's own seven-year conversion range still produces 10.15%. Under an adjacent window — dropping FY2024's 24.7% as a high outlier and averaging only FY2019–FY2023 (19.5%) — the mid-cycle figure becomes $21,617m × 19.5% − $724m = $3,491m, or 11.42%.
The assumption most likely to be wrong is capital expenditure. It rose from $1,388 million in FY2023 to $1,569 million and then $1,763 million [36], and Q1 2026 capex of $458 million was 37% above the prior-year quarter [37]. Management guides capex approximately flat with 2025 [38]; each $200 million of overrun takes about 65 basis points off the yield.
The consensus check
The consensus set carries a direct free-cash-flow consensus — not a proxy metric — with a 31 July 2026 vintage, which post-dates both the February 2026 full-year results and the May 2026 first-quarter report.
Consensus FCF and yields on reported basis per fit_features.consensus_forward_yield (CapIQ, vintage 31 July 2026); adjusted basis derived by deducting SBC ($360m in FY2026, $370m in FY2027) and the applicable five-year average acquisition spend.
Consensus expects $3,880 million of free cash flow in FY2026 — a 12.70% yield on the reported basis and, after deducting SBC and averaged acquisition spend, 10.33% on the framework's basis. FY2027 is $4,280 million, or 12.25% adjusted. Both clear the 10% bar without needing a recovery thesis.
That consensus is not a stretch relative to what management has told the market. FY2026 guidance is adjusted EPS of $8.00 to $8.30 on a weighted-average share count of approximately 530 million [39], with free cash flow conversion of approximately 90% of adjusted net income [40]. That arithmetic — 530m × $8.00–$8.30 × 90% — gives $3,816 to $3,959 million. Consensus of $3,880 million sits inside the guided range rather than above it. The sell side is underwriting the company's own plan, not a recovery beyond it.
The setup that follows from those two facts is fear rather than a forecast dispute: consensus already carries a forward adjusted yield above the bar, and the equity has still fallen 80% from its March 2025 peak (fit_features.capitulation_gauge), the anatomy of which is in Dislocation.
What consensus is assuming, and where it could break. The FY2026 plan is heavily second-half weighted. Q1 2026 GAAP operating income fell 34% to $918 million and operating margin fell 890 basis points to 18.3%; Merchant margin fell 780 basis points and Financial 940 [41]. Against that, the guided full-year adjusted operating margin is approximately 34%, composed of 31–32% in the first half and 35–36% in the second [42]. Roughly 400 basis points of second-half margin expansion has to arrive for the consensus FCF figure to land. Q1 free cash flow of $259 million on the company's own definition was in line with the seasonal pattern management set out in February [43], so the first data point is consistent with the plan; the margin inflection is not yet evidenced.
The path if the second half disappoints. Since consensus already sits above the bar, no mean-reversion underwrite is required for the base case. The relevant question is the downside: how far conversion has to fall before the 10% line breaks. Adjusted FCF of $3,056 million is the break-even — 10.0% of $30,563 million — which implies reported FCF of $3,780 million, or 17.5% of a $21,617 million revenue base. That is below every year in Fiserv's seven-year conversion history, whose floor was 17.7%. Put in guidance terms, at unchanged 90% conversion on approximately 530 million shares, adjusted EPS would have to come in near $7.90 — 1% below the bottom of the guided $8.00–$8.30 range and roughly 3% below its midpoint. Assigning a probability to that outcome: guidance has been reiterated once since February and the 37-analyst FY2026 adjusted-EPS mean has been unchanged at $8.12 over the past 90 days, so no part of that risk is currently in the estimates — I would put the chance that FY2026 adjusted FCF lands below the 10% threshold at roughly 20–25%, rising materially if the second-quarter margin fails to inflect toward the guided 31–32% first-half average. Conversely, the mechanisms that would push the yield higher are already in motion and named: the Project Elevate cost programme, the exit of underperforming Merchant businesses in India, two closed offices and reduced management layers [44]. Management describes 2027 as the first full year of visible growth [45].
FCF to revenue
Reported FCF from each year's Consolidated Statements of Cash Flows [46][47][48]; revenue from the corresponding Consolidated Statements of Income [49][50][51].
Conversion is stable, not deteriorating. The seven-year range is 17.7% to 24.7% and FY2025's 20.3% is within 10 basis points of the seven-year mean of 20.4%. The trough years were 2021 and 2022, when First Data integration spending was heaviest, and the peak was 2024. FY2026 consensus implies about 18.0% on a $21.6 billion revenue base — inside the historical band, at the lower end.
The related stability test looks similar. Rolling five-year average reported FCF was $3,022 million for 2019–2023, $3,619 million for 2020–2024 and $3,830 million for 2021–2025 — rising in each window, with a coefficient of variation across the three of 9.8% and no negative free-cash-flow year in seven. The framework asks for a stable rolling five-year average rather than smooth annual figures, and Fiserv's record meets that description on reported FCF. On the adjusted basis the equivalent test cannot be run: only three consecutive adjusted years are computable, and one of them is distorted by the 2019 acquisition window.
The two facts that cut against the conversion picture, stated together: capital expenditure has risen 27% over two years while revenue rose 11%, and the FY2026 consensus implied conversion of 18.0% would be the third-lowest reading in the series. Neither is a break in trend yet; both are the specific things a falsifier would watch. The durability of the underlying revenue base over the eight-to-twenty-year horizon is examined in Durability.
What This Tab Establishes
Fiserv holds the structural markers the framework looks for: non-discretionary products, 80% of revenue under multi-year contracts, examination by the federal banking agencies, $4.6 trillion of annual merchant volume, and an unbroken SEC filing record back to 1994. It does not hold them in the present tense. Organic revenue ran 16% in 2024, 3.8% in 2025 and −3.6% in the March 2026 quarter, with every Financial Solutions line negative and consolidated operating margin down 890 basis points.
Where the Conviction Comes From
The year-10 test asks whether revenue and adjusted free cash flow will be higher in a decade, with very high conviction. Five sources can supply that conviction. Four apply to Fiserv in some measure; one does not, and saying so matters more than adding it to the pile.
Annual Merchant Volume ($T)
Share of U.S. Payment Volume
Financial Institution Clients
Issuer Accounts on File (B)
Source: 2026 Investor Day, Unmatched Scale Driving Attractive Financial Model [1].
Market structure. The Financial Solutions half is genuinely concentrated. Fiserv reaches 6,000-plus financial institution clients, 339 million deposit and loan accounts and 1.8 billion issuer accounts on file, and says one of its Financial Solutions capabilities serves 80% of the U.S. market [2]. The peer set confirms the shape rather than contradicting it: Jack Henry signed 51 new core deals in its fiscal 2025 across a US banking market of thousands of institutions [3], and the issuer-processing field consolidated further in January 2026 when Global Payments sold Issuer Solutions to FIS and bought Worldpay [4]. The Merchant half is not concentrated, and Fiserv does not claim it is: its own 10-K calls the market "fragmented, highly competitive, and served by a multitude of large and small businesses," and names ISOs, ISVs, payment networks and large technology providers as competitors [5]. Market structure supports the half that generated $9.7 billion of FY2025 revenue and does not support the half that generated $10.1 billion [6].
Regulatory entry barriers — real, and specific. Fiserv is a significant service provider under the Bank Service Company Act and is examined directly by the Federal Reserve Board, the FDIC and the OCC, under FFIEC uniform standards [7]. It also holds a Merchant Acquirer Limited Purpose Bank charter in Georgia, trust companies regulated in New Hampshire and Colorado, and direct or associate Visa and Mastercard memberships [8]. This is the barrier that blocks a garage startup from taking a community bank's core deposit ledger. It does not block Square from taking a coffee shop's card terminal, and that distinction runs through the rest of this tab.
Capital intensity — does not apply. Net property and equipment was $3,084 million at December 31, 2025 [9] against total assets of $80,548 million and goodwill of $37,602 million at March 31, 2026 [10]. The balance sheet is a record of prices paid for acquisitions, not a physical asset base a rival would have to replicate. Capital intensity is not a moat here, and nothing in this tab leans on it.
Essentialness. The 10-K states it directly: "Most of the products and services we provide are necessary for our clients to operate their businesses and are therefore non-discretionary in nature," and 80% of 2025 revenue was processing and services under multi-year contracts that "generally have high renewal rates" [11]. The recession evidence is thinner than the language suggests, because the First Data merger closed in July 2019 and scrambles the comparison. On the one comparable basis available — pro-forma 2019 revenue of $15,775 million as if First Data had been owned from January 1, 2018 [12] — 2020 revenue of $14,852 million was 5.9% lower [13]. Free cash flow went the other way in that year, rising from $2,074 million in 2019 to $3,247 million in 2020 (both from fit_features.adjusted_fcf.series, charted below). Demand bent in a shutdown; cash generation did not.
Operating history. The corpus does not carry a founding date, but it carries the filing record: Fiserv's SEC filing history runs continuously back to a 1994 Form 10-K filed February 28, 1995 [14]. That is 32 years as a public reporting company through two recessions and a pandemic — inside the framework's 30-to-50-year range, at its lower edge.
| Conviction source | Applies to Fiserv | Evidence |
|---|---|---|
| Market structure | Partly — Financial yes, Merchant no | 6,000-plus FI clients, 80% U.S. reach; Merchant market self-described as fragmented |
| Regulatory entry barriers | Yes | Bank Service Company Act significant service provider; FFIEC examination; MALPB charter |
| Capital intensity as a moat | No | Net property and equipment $3.1B vs $80.5B assets; $37.6B goodwill |
| Essential products | Yes | Non-discretionary per Item 1; 80% of revenue on multi-year contracts |
| Long operating history | Yes, at the lower edge | Continuous SEC filings since the 1994 Form 10-K |
Sources: FY2025 Form 10-K — a fragmented, highly competitive market [15]; significant service provider under the Bank Service Company Act [16]; non-discretionary products and 80% of revenue under multi-year contracts [17]; 2026 Investor Day merchant gross payment volume and financial institution clients [18]; the chronological filing index back to the 1994 Form 10-K [19].
The business economics (Business) sit on top of these; what this tab adds is that four of the five conviction sources hold, and that the strongest of them protects the segment now shrinking fastest.
Threats, Named and Sized
The Growth Rate Turned Negative
Sources: 16% organic revenue growth for full-year 2024 [20]; 3.8% organic revenue growth for 2025 [21]; total company organic revenue down 3.6% in the March 2026 quarter [22]; 2026 organic revenue growth guidance of 1% to 3% [23].
Organic revenue grew 16% in 2024 [24], led by 27% in Merchant Solutions [25]. It came in at 3.8% for 2025 [26], and reported revenue fell 2% in the March 2026 quarter, to $5,027 million from $5,130 million [27]; total company organic revenue was down 3.6% [28]. Guidance for 2026 is 1% to 3% organic [29].
Part of the 2024 figure was never durable and the company said so at the time. Excess Argentine inflation and interest contributed 4 percentage points to full-year 2024 total-company revenue growth, and the Dólar Turista program another 1 point — 8 points and 3 points respectively within Merchant Solutions [30]. Five of the 16 points of 2024 organic growth, and 11 of Merchant's 27, came from an Argentine rate and inflation environment the company itself benchmarked against a 2018-2022 average and labelled transitory. Stripping it, the underlying 2024 rate was roughly 11%, and the step down to 3.8% and then to −3.6% is smaller than the headline but still a two-thirds contraction over eight quarters.
Five of Six Lines Went Negative
Sources: Q1 FY2026 earnings presentation — Small Business, Enterprise and Processing revenue [31]; Digital Payments, Issuing and Banking revenue [32].
Five of six business lines declined organically in the March 2026 quarter. All three Financial Solutions lines — Digital Payments, Issuing and Banking — were negative [33], the segment protected by the regulatory barrier and the multi-year contracts. That is the fact most damaging to the conviction case, because it is the fact the moat was supposed to prevent.
The counter-evidence sits on the same two slides and deserves equal weight. Underlying activity grew: Zelle transactions up high-teens, debit processing transactions and global issuing accounts on file up low-single-digit, Finxact accounts and positions up more than 70% [34]; Clover gross payment volume rose 12% excluding the gateway conversion, small-business volume 7%, enterprise transactions 8% [35]. The 10-Q attributes the quarter's decline principally to lower data and analytics sales and license revenue, and to lower Latin American anticipation revenue as inflation and rates normalised [36]. Volumes are not leaving. Revenue per unit of volume is.
Clover's Installed Base Shrinks
Fiserv's own medium-term Clover bridge starts with same-store sales at about −1.5% and builds 10-15% gross payment volume growth from net new sales of roughly +6.5% and non-Clover conversions of roughly +2.5%, then adds about 6.5 points of revenue uplift from value-added services, capital products and conversion pricing to reach a 15-20% revenue outlook [37]. Nothing in that bridge comes from the merchants Clover already has.
Meanwhile the closest direct competitor is winning volume faster. Block reported Square gross payment volume up 13% in the March 2026 quarter, 11.5% in constant currency, with mid-market seller volume up 22% [38]; management expects to accelerate that volume growth into the low-to-mid-teens range in 2027 and 2028 [39]. Clover's reported figure for the same quarter was 9%, 12% excluding the gateway conversion [40].
Sizing that for year 10, using the company's own bridge components. Clover finished 2025 at $3.3 billion of revenue, up 23% [41], about 16% of the $21,193 million company total [42]. Compound $3.3 billion at the midpoint of management's 15-20% for ten years and Clover is a $16.5 billion business. Halve net new sales to +3.25%, let the conversion pipeline run dry, and hold the same ~6.5 points of pricing and attach uplift: volume growth falls to about 1.75%, revenue growth to about 8%, and Clover is a $7.1 billion business in 2036. The gap between those two paths is roughly $9 billion of annual revenue, about 44% of everything Fiserv earned in 2025. That is the size of the wager the growth case makes, and it is a wager on new customer acquisition against a competitor currently acquiring faster — which is execution, not structure.
Distribution Runs Through Partners
Fiserv's merchant business reaches merchants through 1,000-plus bank partners, 3,000-plus ISOs and roughly 2,000 ISVs [43]. Those arrangements are for fixed terms and can end: Wells Fargo gave notice of non-renewal on the Wells Fargo Merchant Services alliance in the third quarter of 2024, the joint venture expired on April 1, 2025, and Fiserv received an initial cash payment of $453 million while retaining a multi-year processing agreement [44]. The 10-K also names bank consolidation as a revenue risk, since mergers eliminate clients and give survivors more negotiating leverage or the scale to insource [45], and warns that larger clients can seek lower prices at renewal or move services in-house [46].
Substitution Risk Not Yet Sized
The obvious ten-year technology threats — account-to-account rails, stablecoins, pay-by-bank — appear in the filings as an investment risk rather than a demonstrated volume loss. Fiserv is building into them rather than defending against them: it intends to offer custody for stablecoin reserves under the GENIUS Act to help financial institutions retain funds associated with FIUSD issuance, and states plainly that its assumptions about final stablecoin regulation may be wrong and that customer demand is unclear [47]. The corpus contains no disclosure that quantifies disintermediated volume to date, and live web research was unavailable for this run, so no year-10 number is offered here. On the margin question — whether anyone's margin here is an opportunity for someone else — the answer is measurable and it is yes: Financial Solutions earned a 45.3% operating margin in 2025 and Merchant 34.5% [48], and by the March 2026 quarter those had fallen to 38.1% and 26.4% [49]. The compression is already happening.
Reset and Litigation
The October 29, 2025 guidance reset cut 2025 organic growth expectations to 3.5-4% and adjusted EPS to $8.50-8.60, and launched the One Fiserv action plan [50], with the CEO saying "our current performance is not where we want it to be nor where our stakeholders expect it to be" [51]. Separately, three federal securities class actions are pending, consolidated in New York and Wisconsin, alleging that statements about Clover's growth and about second-quarter 2025 earnings were false or misleading [52]. Neither is a structural fact about the business. Both bear on how much weight the disclosed growth history can carry.
The Disqualifier Check
The framework disqualifies a long-established business whose revenue has declined at a high-single-digit rate for three consecutive fiscal years. The deterministic feature file records revenue_trajectory.consecutive_decline_years = 0 and revenue_trajectory.three_year_hsd_decline = false.
Sources: FY2017-FY2021 from fit_features.revenue_trajectory.per_year; FY2022 and prior years confirmed in the FY2022 Form 10-K [53]; FY2023-FY2025 total revenue from the FY2025 Form 10-K [54].
Two things about that flag. First, the feature file's revenue series stops at FY2021, because the structured income file carries no revenue field for FY2022 through FY2025; the flag was therefore computed on a five-year window, not the full history. Second, extending the series from the filings does not change the answer — revenue rose in every year from 2017 to 2025, including through 2020. The disqualifier is not triggered, and it is not close: the record shows nine consecutive years of increase, not three of decline.
The structural-decline evidence that does exist is younger and narrower than the disqualifier contemplates: one quarter of −2% reported revenue [55]; organic revenue down 3.6% [56]; five of six business lines negative, Processing at −14% [57]; and 2026 guidance of 1-3% [58]. Stated plainly: the exclusion for structurally declining businesses is checked and not met on the filed record; what the record does show is one quarter of decline inside a two-year deceleration.
Cash Flow Consistency
The framework wants the rolling five-year average of adjusted free cash flow to be stable rather than unpredictable. That series cannot be built from the feature file: fcf_stability.rolling_5y_avg is empty and not_computable records "fewer than five consecutive adjusted-FCF years," because share-based compensation is absent from the structured cash-flow data for every year from 2018 to 2025.
Source: annual free cash flow from fit_features.adjusted_fcf.series[].fcf; rolling averages derived from that series. FY2025 components confirmed in the FY2025 Form 10-K consolidated statements of cash flows [59].
On the reported basis the series is consistent by the framework's standard. There are no negative years in the eight-year record, and the rolling five-year average rose in every window available: $2.51 billion for 2018-2022, $3.02 billion for 2019-2023, $3.62 billion for 2020-2024, $3.83 billion for 2021-2025. Year-to-year volatility exists — free cash flow fell 15% in 2025, from $5,062 million to $4,299 million — but volatility is permitted and unpredictability is not; a series whose five-year average has risen 53% across four windows without a loss year is predictable. There is no negative-episode cadence to explain, because there are no negative episodes: this is not an underwriting business, and the 5-to-8-year loss cycle the framework tolerates for insurers and banks has no analogue here.
Two qualifications the reader needs. The FY2025 cash-flow statement shows operating cash flow of $6,062 million, capital expenditures of $1,763 million, share-based compensation of $357 million and $820 million of payments for business acquisitions [60]. The feature file's acquisition input treats FY2022 through FY2025 acquisitions as zero, which the filings contradict — acquisition payments were $139 million in 2020, $848 million in 2021, $988 million in 2022, $13 million in 2023, nil in 2024 and $820 million in 2025. Reconstructing the framework's definition from the filed figures — free cash flow less share-based compensation less the trailing five-year average of those acquisition payments — gives adjusted free cash flow of about $4.30 billion in FY2024 (5,062 − 367 − 398) and about $3.41 billion in FY2025 (4,299 − 357 − 534), a 21% decline in one year. The full adjusted series still cannot be built back to 2018, so the rolling-average test is answered on the reported basis and flagged. The yield arithmetic that rests on these figures belongs to Yield.
The Year-10 Case Both Ways
The case that 2036 revenue and adjusted free cash flow are higher. Fiserv processes 300 billion transactions and $4.6 trillion of merchant volume a year, holds 1.8 billion issuer accounts, serves 6,000-plus financial institutions, and touches 95% of U.S. households [61]. Eighty percent of revenue arrives under multi-year contracts for services the 10-K describes as non-discretionary [62]. A rival wanting the Financial Solutions half must pass federal banking examination as a significant service provider [63]. Underlying volumes are still growing in a quarter when revenue fell — Clover volume up 12% ex-conversion, Zelle transactions up high-teens, issuing accounts up [64] [65]. Free cash flow has never been negative in the available record and its five-year average has risen in every window. Management's 2027-2029 plan is a 4-6% adjusted revenue CAGR, a 37%-plus 2029 adjusted operating margin, ~90% free cash flow conversion and more than $13.5 billion of cumulative free cash flow [66]. Ten years of even 1-3% growth on a $21.2 billion base clears "higher than today" comfortably.
The case against. The company reset its earnings baseline in October 2025 and its growth rate has gone from 16% to 3.8% to −3.6% in eight quarters, with roughly five of the 2024 points sourced from an Argentine inflation and rate environment it had already labelled transitory [67] [68] [69]. Every line of the regulated, contracted Financial segment declined organically in the March 2026 quarter [70]. Consolidated operating margin fell 890 basis points year over year in that quarter, to 18.3%, with Merchant down 780 and Financial 940 [71]. The growth engine's own bridge assumes its installed base shrinks 1.5% a year and rests entirely on new-customer acquisition and conversions [72], while the nearest competitor grew its volume 13% in the quarter Clover grew 9% [73]. Reconstructed adjusted free cash flow fell about 21% in FY2025. And the moat, where it is real, protects the ledger — not the price charged for keeping it.
The read. Year-10 revenue higher than today's $21.2 billion is well supported and I would underwrite it: the services are non-discretionary, the contracts are multi-year, the regulatory barrier is specific and binding, and volumes grew in the quarter revenue fell 2%. Year-10 adjusted free cash flow higher than today's is where the doubt is genuine, and it is not a doubt about demand — it is about price. Fiserv's cash flow depends on holding 34-45% segment operating margins in a Merchant market it describes as fragmented and highly competitive, and those margins fell 780 and 940 basis points in a single year while volumes rose. Nothing in the record shows the pricing power that turns growing volume back into growing cash; what it shows is a company that grew revenue 16% on inputs it has since told investors were transitory, and that has reset its baseline twice in twelve months. Under a standard where any proper doubt fails the test, there is a genuine doubt here: the margin path that carries free cash flow to 2036 is currently moving the wrong way, and the segment best protected by the moat is the one shrinking fastest.
What would change it. Two consecutive quarters in which Financial Solutions organic revenue returns to growth with segment operating margin stabilised at or above 42%, and a Clover disclosure showing same-store sales at or above zero rather than the −1.5% assumed in the company's own bridge. Either would convert the present doubt from structural to cyclical. A third consecutive year of adjusted free cash flow decline, or Clover volume growth falling below Square's for four consecutive quarters, would settle it the other way. The near-term repricing question and its timing belong to Damage Math and Clock; the share-count and buyback mechanics that convert this cash flow into per-share value belong to Self-Help.
Self-Help
Fiserv can outlast the problem. Only $1.2 billion of debt falls due in 2026, against an $8.0 billion revolver running to 2030 and covenant room worth roughly 15% of EBITDA. What it has stopped doing is buying its own stock. Quarterly repurchases fell from $2.2 billion at about $223 a share to $200 million at about $61 — spending tracked the price down, not up. Management's stated priority is the leverage ratio.
The balance sheet against the problem's duration
Total debt was $28,997 million at December 31, 2025 — $1,239 million of short-term and current maturities plus $27,758 million long-term [1]. By March 31, 2026 that had edged to $29,182 million — $1,323 million short-term plus $27,859 million long-term [2]. Cash and equivalents were $798 million at year-end and $829 million at the end of March, of which only $335 million was classified as available — the rest sits in settlement advances, regulated entities, cash in transit and joint ventures [3].
Source: FY2025 Annual Report (Form 10-K), Note 12 Debt — annual maturities of total debt [4].
Total principal payments of $29,166 million reconcile to $28,997 million of total debt after $169 million of unamortized discount and deferred financing costs [5]. Two presentation points matter for reading that table. The 2026 line of $1,239 million is entirely foreign lines of credit and current finance-lease obligations [6]; the $2.0 billion 3.200% notes contractually due in July 2026 are classified as long-term and sit in the 2030 column, because the company has the ability to refinance them under the revolver [7]. The same treatment moves $1,165 million of commercial paper into 2030 [8]. On a strictly contractual reading the next twelve months carry about $3.2 billion of paper to roll, not $1.2 billion — all of it refinanceable, but refinanceable is the operative word.
The revolver was replaced in August 2025 with a new $8.0 billion senior unsecured multicurrency facility maturing August 2030 [9]. Undrawn capacity net of borrowings, commercial paper backstop, near-term notes and letters of credit was $4.6 billion at December 2025 [10] and $3.8 billion at March 2026 [11]. The one financial covenant is a leverage test: consolidated indebtedness at each quarter-end no more than 3.75 times consolidated EBITDA as defined, with the company in compliance throughout 2025 and the first quarter of 2026 [12]. Management reported gross leverage below 3.2 times at March 31, 2026 [13]. Holding debt flat, covenant EBITDA would have to fall from roughly $9.1 billion to roughly $7.8 billion — about 15% — before the 3.75x test binds. That is real cushion, though the $9.1 billion base is an adjusted figure: the debt-to-adjusted-EBITDA measure management reports leverage against excludes merger and integration costs, severance costs, One Fiserv transformation expenses and share-based compensation [14]. Measured on reported EBITDA the cushion is narrower.
Refinancing is not free. The paper coming due was issued in a lower-rate world — 3.200% (July 2026), 5.150% and 2.250% (2027), 1.125% euro (2027) — and the replacements are pricing at 4.550% and 5.250% for the August 2025 dollar issue and 3.750% and 4.250% for the June 2026 euro issue [15] [16]. Net interest expense has already gone from $976 million in 2023 to $1,195 million in 2024 to $1,493 million in 2025 — a $517 million increase over two years against operating income of $5,818 million [17].
On the framework's own rule — levered at net debt of three times EBITDA or more — Fiserv sits on the line. fit_features.balance_sheet_class reports unknown, with the reason "debt or cash missing for FY 2025", so the deterministic classification is unavailable; management's own disclosed measure is 3.0 times at December 2025 and below 3.2 times gross at March 2026 [18] [19]. The bar this company faces is therefore either the 10% moderate line or the 25% levered line, and the answer to that is set out in Yield.
The plain answer on outlasting: yes. Nothing in the maturity schedule forces a decision in 2026 or 2027, the facility runs to 2030, the debt is entirely senior unsecured with no secured layer, and the covenant is a single leverage test with room. The constraint is not solvency. It is that management has chosen to spend the cash on the leverage ratio.
The repurchase record — executed, not authorized
Fiserv has been a genuine repurchaser for a decade. Diluted weighted-average shares fell from 683.4 million in FY2020 to 549.0 million in FY2025, a five-year compound rate of −4.3% (fit_features.share_count_trend.cagr_5y_pct), and the trend flag is rising: false. The share count is not being inflated by stock compensation or serial acquisition — the framework's hard-fail condition on this pillar is not met.
Sources: FY2025 10-K Consolidated Statements of Equity for 2023–2025 share counts and amounts [20]; FY2022 10-K equity statement for 2020–2022 [21]; FY2021 10-K equity statement for 2019–2020 [22]. Average price is repurchase spend divided by shares retired, on share counts rounded to millions in the equity statements.
Across FY2019 to FY2025 the company spent $22,987 million retiring roughly 174 million shares, an average of about $132 a share. The stock closed at $55.67 on 29 July 2026 (fit_features.market_cap.price). Those same 174 million shares would cost $9.7 billion today. The FY2025 program alone — 32.2 million shares for $5.6 billion, an average of $174 [23] — was executed at roughly three times the current price. The 4.1 million shares bought back from ValueAct in August 2023 went at $121.98 [24].
The quarterly path is where the framework question is actually decided.
Sources: Q1 FY2026 10-Q equity statement and Item 2 issuer purchases for 1Q25 and 1Q26 [25] [26]; Q2 and Q3 FY2025 earnings calls for 2Q25 and 3Q25 [27] [28]; Q4 FY2025 earnings call and FY2025 10-K Item 5 for 4Q25 [29] [30]. Average price is spend divided by shares repurchased.
In the first quarter of 2025, with the stock near its 3 March 2025 peak of $237.79 (fit_features.capitulation_gauge), Fiserv bought 9.7 million shares for $2.2 billion [31]. In the first quarter of 2026, with the stock in the low sixties, it bought 3.3 million shares for $200 million — no purchases at all in January, 2.5 million shares at $60.96 in February and 763,623 shares at $62.33 in March [32]. Spend fell 91% year on year while the price fell 72%. December 2025 saw no repurchases either [33].
Authorization is not the constraint. The board authorized 60.0 million shares in February 2025, the authorization does not expire, and 42.6 million shares remained available at March 31, 2026 [34]. At $55.67 the unused authorization is worth $2.4 billion of stock — a little over half of one year's free cash flow. The capacity exists and is not being used.
What management has said about the buyback
The buyback question has been asked and answered on every call through the drawdown, and the answer has moved.
In July 2025, with the stock already down but the guidance intact, the CFO raised the target: "We previously expected to return approximately 110% of free cash flow back to shareholders through share repurchase, and we now expect to return approximately 130%, which aligns with the upper end of our targeted leverage range" [35].
In October 2025, at the reset call, the new CEO put it conditionally: "Our capital management strategy hasn't changed; we plan to invest organically and make selective acquisitions, and we'll continue to buy back shares as needed. We're maintaining our leverage guidelines" [36]. Repurchases that quarter were 7 million shares for about $1 billion, and total debt stood at $30.2 billion with leverage at 3.0 times against a 2.5–3.0x target [37].
In February 2026 the ordering became explicit. The CFO: "We also repurchased 3 million shares during the quarter for approximately $200 million and paid down over $1 billion in debt after funding the acquisitions of StoneCastle and a portfolio of TD merchant contracts" — five times as much to debt as to stock, in the quarter the stock traded in the sixties. Buybacks were framed as the residual: "to the extent we generate any excess cash from business and asset optimization activities, we intend to deploy this additional cash to share repurchase" [38].
In May 2026 the CFO said it in one sentence: "We repurchased 3.3 million shares during the quarter for approximately $200 million. As we noted in February, we are focused on managing our leverage ratio and remain committed to returning capital to shareholders" [39].
The May 2026 Investor Day formalised it. The medium-term capital-allocation commitment reads: "Majority of free cash flow directed to stock buybacks while targeting low-end of 2.5-3.0x" [40], with the leverage pillar described as "Remain committed to investment-grade ratings, targeting lower end of leverage range by 2029" and capital return as "Return excess cash to shareholders, through stock buybacks with value-focused deployment" [41]. Free cash flow of over $13.5 billion is targeted across 2027–2029 [42].
Two things are true at once. The majority of free cash flow is promised to buybacks, which is a substantive commitment. And it is promised while moving leverage from 3.0x toward 2.5x on an EBITDA base guided to shrink in 2026 — which means debt reduction has a claim on the same cash, at the moment the repurchase tailwind is largest. That is the framework's stated falsifier — capital allocation pivoting to debt paydown over repurchases — and it is presently observable in the cash-flow record, not merely a risk.
The action taken at the price low was on the debt side. On 16 June 2026, with the stock at its 22 June trough of $47.18, the company launched a cash tender for any and all of its 5.150% notes due 2027 and 4.400% notes due 2049, conditional on receiving proceeds from a new euro notes offering [43]. That offering closed on 23 June at €500 million of 3.750% notes due 2030 and €500 million of 4.250% notes due 2034 [44]. Retiring a discounted 2049 bond is defensible capital allocation. It is not the buyback flywheel.
Insiders did buy, and they bought at the bottom. Between 16 and 17 June 2026 the CFO purchased 10,060 shares at $49.70, the chief administrative and legal officer 10,150 shares at $49.33, and four directors a further 14,571 shares between $48.41 and $50.59 — roughly $1.7 million in aggregate open-market purchases [45]. Genuine, well-timed, and small: $1.7 million against a $30.6 billion market capitalisation.
The levered exception
Where the balance sheet is levered, the framework tolerates the debt only when three things hold together. All three have to compute.
Leg one — a yield of roughly 25% or more. fit_features.adjusted_fcf_yield is not_computable, because the feature file carries no share-based compensation for any year from FY2018 to FY2025 and therefore no complete adjusted-FCF series. The 10-K does disclose the components. FY2025 free cash flow of $4,299 million (operating cash flow $6,062 million less capital expenditures of $1,763 million), less share-based compensation of $357 million, less the trailing five-year average of acquisition payments of $534 million — 2021 $848 million, 2022 $988 million, 2023 $13 million, 2024 nil, 2025 $820 million — gives adjusted free cash flow of $3,408 million [46] [47]. On the market capitalisation of $30,563 million that is 11.2%. Against a 25% levered bar, short by roughly 14 percentage points. This leg fails.
Leg two — a demonstrated multi-year reduction in share count. Diluted weighted-average shares fell 683.4 million to 549.0 million between FY2020 and FY2025, −19.7% in five years. This leg holds.
Leg three — free cash flow relative to revenue not deteriorating. Reported free cash flow was 19.8% of revenue in FY2023, 24.7% in FY2024 and 20.3% in FY2025, on revenue of $19,093 million, $20,456 million and $21,193 million [48] [49]. The FY2025 ratio is below FY2024 by 440 basis points and roughly level with FY2023. Guidance for 2026 is free cash flow conversion of about 90% of adjusted net income on adjusted EPS of $8.00 to $8.30, against $8.64 delivered in 2025 [50]. This leg is contested at best.
One leg of three holds. The levered exception does not compute here, and nothing in this tab should be read as clearing it.
The absurdity check
fit_features.float_retirement_years is not_computable for the same reason the yield is: no adjusted-FCF series. On the filings-based derivation above, the arithmetic is $30,563 million of market capitalisation divided by $3,408 million of adjusted free cash flow — 9.0 years of adjusted free cash flow to retire the entire float at today's price. Using the company's own defined free cash flow of $4,435 million for 2025 [51], less the same compensation and acquisition adjustments, the figure is 8.6 years.
The framework's reference point for a price making a claim that cannot survive is around three years. Nine is a different statement: cheap on cash generation, not absurd. And on the 2026 plan the company will spend a minority of that year's free cash flow on stock, so the practical retirement rate is slower than the arithmetic allows.
Dividend safety
Fiserv has never paid a dividend on its common stock and does not anticipate paying one [52]; the stated policy is to use operating cash flow for capital expenditures, merchant and settlement advances, share repurchases, acquisitions and debt repayment rather than dividends [53]. No part of the return case rests on a dividend, and the coverage test does not apply.
Promise against delivery
The framework treats big claims paired with repeated misses and thin ownership as disqualifying, so the record needs naming rather than characterising. Five material commitments made between February and July 2025, and what happened to each:
Sources: Q4 FY2024 earnings call, 5 Feb 2025, for the 2025 guidance and the fortieth-consecutive-year statement [54] [55] [56]; Q2 FY2025 call for the buyback commitment [57]; Q4 FY2025 call for FY2025 outcomes [58].
The sequence within a single year is the point. On 5 February 2025, guidance was 10–12% organic growth, adjusted EPS of $10.10 to $10.30, and a fortieth consecutive year of double-digit adjusted EPS growth [59] [60], with free cash flow of about $5.5 billion and Clover reaching its $3.5 billion revenue target [61]. On 23 July 2025 organic growth was refined to about 10%, the Clover target reaffirmed, and the EPS floor raised to $10.15 [62] [63]. On 29 October 2025 the same year was reset to 3.5–4% organic growth and $8.50 to $8.60 of adjusted EPS [64]. Three months separated a reaffirmation from a two-thirds cut to the growth rate.
The company's own diagnosis is the most direct evidence on the question. The incoming CEO, on 29 October 2025: "Fiserv's recent results have increasingly relied on short-term initiatives. These initiatives place too much emphasis on pursuing in-quarter results as opposed to building long-term relationships" [65]. And on the underlying growth rate stripped of Argentina: "if we look at the growth rates for 2023, 2024, and year-to-date in 2025, we see 6% growth, 6% growth, and 3% growth" [66] — against the 16% headline organic growth reported for 2024 [67]. A company that had presented a 16% organic growth number was, on its own later analysis, growing at 6%.
Economic ownership is thin. As of 27 February 2026, all current directors and executive officers as a group — fifteen people — beneficially owned 324,298 shares [68], against 533,948,657 shares outstanding [69] — 0.06% of the company, about $18 million at today's price. The then-CEO held 18,388 shares; the former CEO who ran the 2024 guidance cycle held none [70]. Directors are subject to a $1,320,000 holding requirement and were compliant at the June 2025 valuation date [71], so the thinness is a matter of scale rather than policy breach.
Three counter-facts belong in the same paragraph, because they cut against reading this as a settled promotional pattern. First, the reset guidance has been met: FY2025 delivered adjusted EPS of $8.64 against the October range of $8.50–8.60 and free cash flow of $4.44 billion against $4.25 billion guided [72]. Second, the people who made the missed promises are gone — and so, now, are their replacements: Michael Lyons resigned as CEO on 12 June 2026, without severance or accelerated vesting [73], thirteen months after taking the role on 6 May 2025 [74], and President Dhivya Suryadevara resigned for good reason on 7 July 2026 [75]. Third, insiders put their own money in at the low.
What that leaves is a documented pattern of over-promising under the prior management, an explicit company admission that reported growth was flattered by in-quarter initiatives and Argentine inflation, near-zero insider economic ownership, and a management team roughly six weeks old whose promise record is a blank page. The falsifier to watch is dated and specific: whether the majority-of-free-cash-flow buyback commitment made on 14 May 2026 shows up as more than $200 million a quarter in the 2026 filings, or whether the leverage ratio keeps first claim. The drawdown itself is set out in Dislocation; the durability of the cash flows funding any of this is in Durability.
What Has to Happen, and Roughly When
The re-rating path here is calendar-driven, not sentiment-driven. Fiserv's own second-half 2026 bridge adds about 7 points of adjusted revenue growth, roughly half of it from a non-recurring comparison that simply lapses [1]. Consensus places the first year-over-year earnings growth in the September 2026 quarter. Against that, the drawdown has no precedent in 36 years of the name's own price history, and the leadership executing the plan changed twice in the last eight weeks.
The Mechanism That Closes the Gap
Four things are in motion, and they can be separated by how much new demand each one requires.
1. The non-recurring comparison lapses — 2H 2026
Fiserv's 2025 revenue carried an unusually large slug of non-recurring items, concentrated in the first half. Management has quantified what happens when that base rolls off: first-half 2026 adjusted revenue growth in the low single digits, second-half growth of 6% to 8% or better [2]. The bridge between the two halves is disclosed component by component.
Source: 2026 Investor Day, Visibility Into the Drivers of 2026 [3].
The largest single piece — about 3.5 of the roughly 7 points — requires nothing of the underlying business except that it holds. The remaining 3.5 points require contracted revenue to convert, volumes to ramp and new products to sell. On the first-quarter call the CFO said the second quarter would be the trough in the year-over-year revenue decline, with a return to "a much more normalized growth picture in the back half" helped by a comparative tailwind in Financial Solutions from third-quarter 2025 actions and by contracted revenue from named client wins [4]. The window is the third-quarter print (late October 2026) and the fourth-quarter print (February 2027).
2. Cost normalization and a named efficiency programme — 2H 2026 into 2029
The margin path is guided on the same calendar: adjusted operating margin of approximately 31% to 32% in the first half of 2026, 35% to 36% in the second half, with the fourth quarter the high point, and roughly 34% for the full year [5]. Beyond 2026, Project Elevate targets a reduction of more than $500 million in 2029 run-rate costs, worth an incremental 200 basis points or more of adjusted operating margin [6], inside a medium-term frame of 37% or better by 2029 [7].
3. Guidance resetting against a bar the company set low itself
The bar was reset in one step, not several. February 2025 guidance was 10% to 12% organic revenue growth and $10.10 to $10.30 of adjusted EPS [8]. On 29 October 2025 that became 3.5% to 4% organic growth and $8.50 to $8.60 of adjusted EPS [9]. The 2026 guide of 1% to 3% adjusted revenue growth and $8.00 to $8.30 adjusted EPS [10] is therefore a guided decline against the $8.64 actually delivered in 2025. Management describes 2026 as a transition year [11]. It has now been reaffirmed twice: at the first-quarter print on 5 May 2026 [12] and again on 15 June 2026 alongside the change of chief executive [13].
The medium-term algorithm published on 14 May 2026 is 4% to 6% adjusted revenue growth from 2026 to 2029 with annual double-digit adjusted EPS growth [14], landing at more than $23 billion of adjusted revenue, more than $13.5 billion of cumulative free cash flow across 2027–2029, and adjusted EPS greater than $12 in 2029 [15]. That $13.5 billion of three-year cash flow is 44% of the $30.6 billion market capitalisation at the 29 July 2026 close of $55.67.
4. Buybacks shrinking the denominator — throttled by the leverage target
Guidance is for a weighted-average share count of approximately 530 million in 2026, against 547.1 million basic weighted-average shares in FY2025 — a reduction of about 3.1% [16]. The pace, however, is set by the balance sheet rather than by the yield. Fiserv repurchased 3.3 million shares for approximately $200 million in the first quarter of 2026 while finishing the quarter at gross leverage below 3.2x and targeting approximately 3.0x at year-end; the CFO framed capital return around "managing our leverage ratio" [17]. Annualised, that first-quarter pace is roughly $800 million, or 2.6% of the market capitalisation, against consensus 2026 free cash flow of $3.88 billion — about one-fifth of cash flow going to repurchase in the year when the yield on that cash flow is 12.7%. The medium-term commitment is that a majority of free cash flow goes to buybacks while the company targets the low end of a 2.5x–3.0x leverage range [18] [19], which places the flywheel after the deleveraging, not alongside it. The maturity and covenant detail sits in Self-Help.
The event that could fail to happen
Two overhangs have dates attached rather than moods. Jana Partners disclosed a stake in February 2026 and pressed for board changes and asset sales [20]; the announced divestiture of ATM Managed Services, Cash and Logistics, and MoneyPass to Bridgeport Partners — about $200 million of 2025 revenue, $275–$300 million of after-tax cash proceeds plus a 49% joint-venture interest — is that agenda converting into cash [21]. The securities class action over Clover migration disclosures, with a class period running July 2024 to July 2025, remains undated as to resolution [22].
The counterweight: who is executing this
Michael Lyons resigned as chief executive and director on 12 June 2026, effective immediately, after roughly seventeen months; Takis Georgakopoulos was appointed chief executive on 14 June 2026 [23]. On 7 July 2026 Dhivya Suryadevara resigned as President for good reason, and the Financial Solutions business — the segment whose revenue declined 6% organically in the first quarter [24] — was handed to two interim leaders [25]. The second-half acceleration and the 2029 algorithm were authored in May 2026 by a management team that no longer holds three of its senior seats. The promise-versus-delivery record of the prior team is the relevant prior: 10% to 12% organic growth guided in February 2025 became 3.5% to 4% eight months later [26] [27].
The Catalyst Calendar
Sources: Q2 2026 date confirmed by the company on 14 July 2026 [28]; later dates are indicative, projected from the reporting pattern of the last two years (Q3 2025 reported 29 October 2025, FY2025 reported 10 February 2026) and are not company-confirmed.
What Consensus Expects, and When
Consensus has the recovery arriving in printed numbers in the September 2026 quarter. The second quarter reporting on 6 August is expected to be the low point.
Source: reported figures and forward consensus means from the run's consensus estimate data, as of 30 July 2026; quarterly reported adjusted EPS also appears in the corresponding results presentations.
Year over year, the sequence is specific. Second-quarter 2026 consensus of $1.92 is 22% below the $2.47 printed a year earlier. Third-quarter consensus of $2.16 is 5.9% above the $2.04 reported on 29 October 2025 — the first positive comparison. Fourth-quarter consensus of $2.27 is 14.3% above $1.99. On revenue the same shape holds: consensus of $5,155 million and $5,181 million for the third and fourth quarters against $4,919 million and $4,900 million a year earlier, or 5.3% growth across the second half.
That 5.3% sits below the company's own 6% to 8%-or-better second-half bridge [29]. The street is underwriting the comparison effect and discounting part of the execution. The candidate quarter is the third quarter of 2026, reported in late October 2026 — the first period in which the direction of travel reverses in a printed number rather than in a slide.
One arithmetic caution on the near-term line: first-quarter 2026 adjusted EPS of $1.79 included a $0.17 benefit from an 11% effective tax rate driven by a valuation-allowance release, against full-year guidance of 19% to 19.5% [30]. First-quarter 2027 consensus of $1.77 therefore reads as a decline against a reported base that was flattered by roughly seventeen cents of timing.
Street positioning
Buy or Outperform (% of 36)
Hold (% of 36)
Mean Target Price
Mean Target vs $55.67 (%)
Source: consensus recommendations and target prices from the run's consensus estimate data, as of 30 July 2026; percentages derived from 36 in-consensus recommendations.
Of 36 in-consensus recommendations, 25 are holds, 6 are buys, 3 outperform, 1 underperform and 1 sell — a consensus recommendation score of 2.67. The mean target price of $66.63 across 27 estimates is 19.7% above the 29 July close of $55.67; the median of $63.00 is 13.2% above it. The high and low targets are $115 and $40, a dispersion of nearly 3:1 that is itself a statement about how little agreement there is on the earnings base.
This is a sell side that has moved to the sidelines rather than one that has capitulated. Only 5.6% of ratings are negative, but only 25% are positive, and the mean target implies a share price 72% below the March 2025 peak. Estimate revisions have not yet turned: the FY2027 adjusted EPS mean has drifted from $9.15 six months ago to $8.93 now, a 2.4% reduction, and the FY2027 revenue mean from $20,978 million to $20,854 million. The out-year is firmer — FY2028 EPS has risen from $9.75 to $10.02 over the same six months — which is consistent with the street marking the margin and buyback algorithm to the Investor Day while still trimming the near term.
Source: consensus free cash flow and adjusted EPS means from the run's consensus estimate data as of 30 July 2026; yields derived against the $30.56 billion market capitalisation at the 29 July 2026 close of $55.67 on 549.0 million shares.
Consensus itself carries a forward free cash flow yield of 12.7% on 2026 and 14.0% on 2027, and the 2029 EPS mean of $11.62 sits about 3% below the company's stated "greater than $12" target [31] — the street is close to underwriting the medium-term algorithm, without the top of it. The yield computation against the framework's bar is worked in Yield.
Base Rates From This Name's Own History
Fiserv's daily price record runs from January 1990. Across 36 years there are seven drawdowns of 30% or more measured close to close from a running peak. Six completed; the seventh is live.
Source: derived from daily closing prices, 2 January 1990 to 29 July 2026, in the run's price history; split-adjusted closes, running-peak method, 30% threshold.
Source: derived from daily closing prices, 2 January 1990 to 29 July 2026, in the run's price history; depth is trough close divided by peak close minus one, durations are calendar months between the dated closes. The 1990 closes are $0.6557 and $0.4390 split-adjusted and display rounded to two decimals.
The arithmetic a skeptic can recompute: 47.18 / 237.79 − 1 = −80.16%, over 476 calendar days from 3 March 2025 to 22 June 2026, or 15.6 months. The median depth of the six completed episodes is 38.0%; this one is 2.1 times that, and 1.56 times the deepest prior episode (−51.5% in 2002). The current episode has no precedent in the name's own 36-year price history — the base rates below describe a different animal and should be weighted accordingly.
Source: derived from daily closing prices, 2 January 1990 to 29 July 2026, in the run's price history; the 2025 episode has no recovery leg yet.
Two readings come out of the completed six. Full round trips — peak back to peak — took a median of 19.8 months and a mean of 23.4 months, but the distribution is bimodal: the four shallower episodes (30% to 38%) round-tripped in 5.8 to 26.4 months, while the two episodes deeper than 50% took 40.8 and 42.3 months. Partial re-rating came far faster. Measured from trough to a 50% gain off the trough, the six episodes took 1.6, 1.9, 2.8, 7.1, 8.2 and 17.8 months — a median of about 5 months. As of 29 July 2026 the stock is already 18.0% above the 22 June trough, five weeks after it.
The relevant scale, though, is set by the depth. A full round trip from the 22 June trough requires a 404% gain; from the 29 July close of $55.67 it requires 327%. A 50% gain off the trough — the milestone that historically arrived in a median of five months — lands at $70.77, still 70% below the March 2025 peak and 6% above the current mean street target of $66.63. Both of the name's genuinely deep drawdowns (2002, 2007–08) were market-wide events with market-wide recoveries; this one is company-specific, which removes the market's own repair from the mechanism and puts the whole burden on the printed numbers. The anatomy of the decline, including the 7.4x volume spike in the peak-to-trough leg, is worked in Dislocation, and the question of how much of the fall reflects permanent damage is in Damage Math.
The 18-Month Test
On the evidence above, re-recognition of the earnings base within 18 to 24 months is a reasonable expectation; re-recognition of the 2025 valuation is not, and no part of the record supports it on that clock.
The supporting arithmetic is that the near-term mechanism is largely a comparison effect rather than a demand recovery: roughly 3.5 of the approximately 7 points of second-half 2026 acceleration comes from the non-recurring headwind lapsing [32], and consensus places the first positive year-over-year quarter in September 2026, three months out. An 18-month window from 31 July 2026 runs to about the end of January 2028 and contains six quarterly prints plus two annual guidance events, including the first guided year of the 2027–2029 algorithm. A 24-month window adds the completed FY2027 result, reported around February 2028 — the first evidence that would confirm or break the algorithm rather than describe it.
The strongest fact against the read is the execution risk sitting on top of it. Three of the senior seats authoring the plan turned over between June and July 2026 [33] [34], and the prior team's February-to-October 2025 guidance path shows what this company's forward numbers have been worth [35] [36]. Sell-side revisions for FY2027 are still drifting down, not up.
What would falsify the read, in the falsifier ledger's terms: second-half 2026 adjusted revenue growth printing below the low-single-digit first-half trend instead of the guided 6% to 8% or better; a third cut to the $8.00–$8.30 adjusted EPS guide; or repurchases staying near the first quarter's $200 million pace through 2027 while free cash flow runs near $3.9 billion, which would confirm that capital allocation has pivoted to deleveraging for the duration of the window.
The Instrument Facts
Stated as facts, with their sources and dates. No part of this section is a recommendation.
Listed equity options on FISV exist and include expiries beyond twelve months. As of 30–31 July 2026, the option chain published by Stock Options Channel runs from weekly expiries through 21 January 2028, which is the longest listed expiry at 540 days, or approximately 17.7 months. Intermediate long-dated expiries include 15 January 2027, 19 March 2027 and 17 June 2027.
Liquidity at the long end is present but concentrated. Barchart's chain for the 21 January 2028 expiry, as of 30 July 2026, shows total open interest of 56,112 call contracts and 16,487 put contracts — 72,599 contracts on that single expiry — against that day's volume of 399 calls and 85 puts. Near-dated activity is heavier: Stock Options Channel reported 10,883 call and 3,632 put contracts traded on 30 July 2026 across all expiries.
On implied volatility, three dated readings:
- 30-day mean implied volatility of 0.5607, or 56.1%, for 29 July 2026 (AlphaQuery, FISV volatility and option statistics).
- 120-day mean implied volatility of 0.4860, or 48.6%, for 29 July 2026 (AlphaQuery, FISV volatility and option statistics).
- At-the-money implied volatility of 46.98% on the 21 January 2028 expiry, with an IV rank of 57.40% and 36.31% historic volatility, as of 30 July 2026 (Barchart, FISV options).
Against the framework's reference lines — up to roughly 50–55 acceptable, 60–70 elevated — the 30-day reading of 56.1% sits just above the acceptable band, and the earnings release scheduled for 6 August 2026 falls inside that 30-day window [37]. The two long-dated readings, 48.6% at 120 days and 47.0% at the January 2028 expiry, sit inside the band. The term structure is downward-sloping, with the 30-day reading 9.1 points above the January 2028 expiry's at-the-money level.
One duration fact matters for the framework's own 18-month reference: the longest listed expiry, 21 January 2028, is 17.7 months from 31 July 2026 and falls approximately three weeks before Fiserv would be expected to report full-year 2027 results — the first completed year of the 2027–2029 algorithm — on the February pattern of the last two years (FY2025 results were reported on 10 February 2026). Longer-dated January 2029 contracts are not listed as of 31 July 2026; whether and when they are listed is a decision of the exchanges, not the company.