Fiserv, Inc.'s management explains the business in its own materials. The slides below do the most of that work, pulled from the documents preserved in Sources. Each source link opens the complete presentation at that slide in a new tab.
The strategic reset under CEO Mike Lyons: what each business is, where share and headroom sit, and the 2027-2029 targets management now owns. · Open the full document →
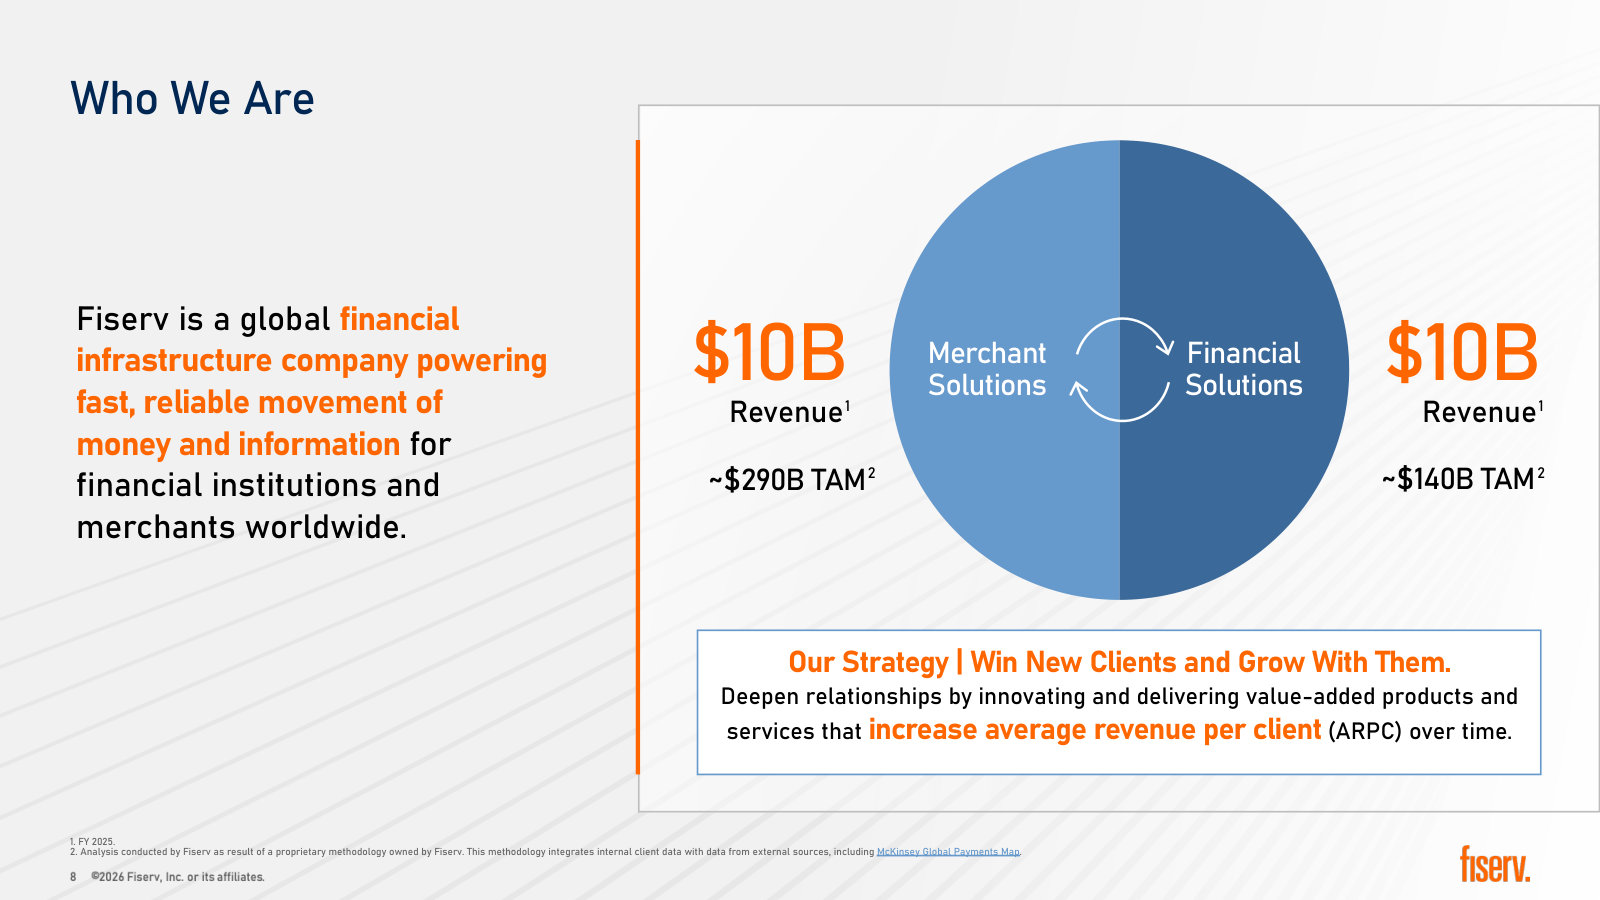
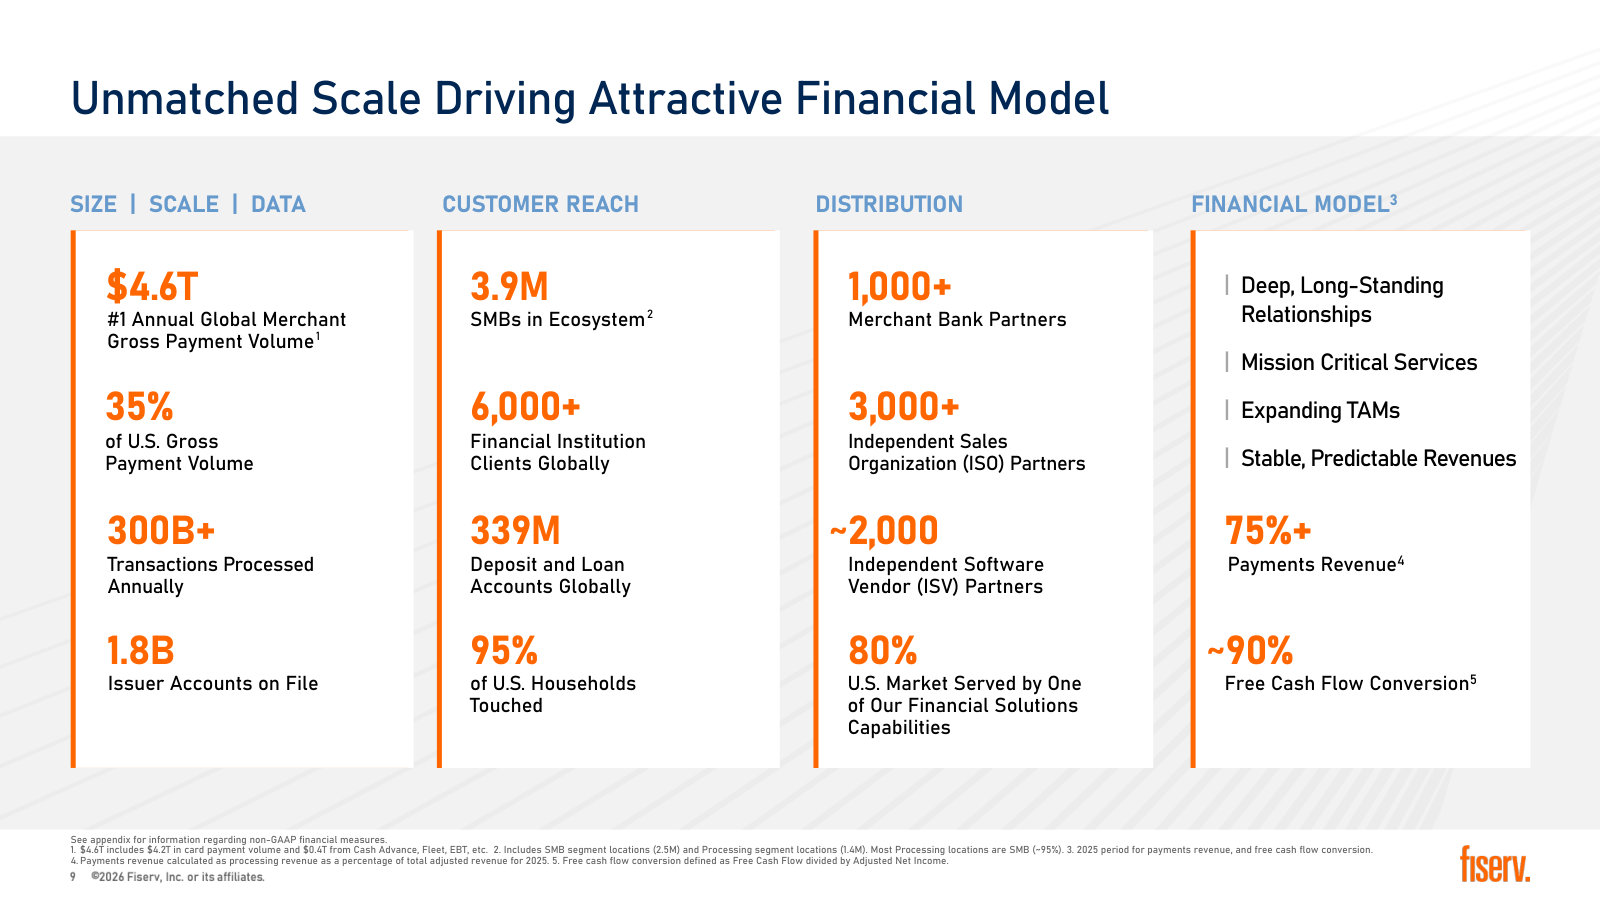
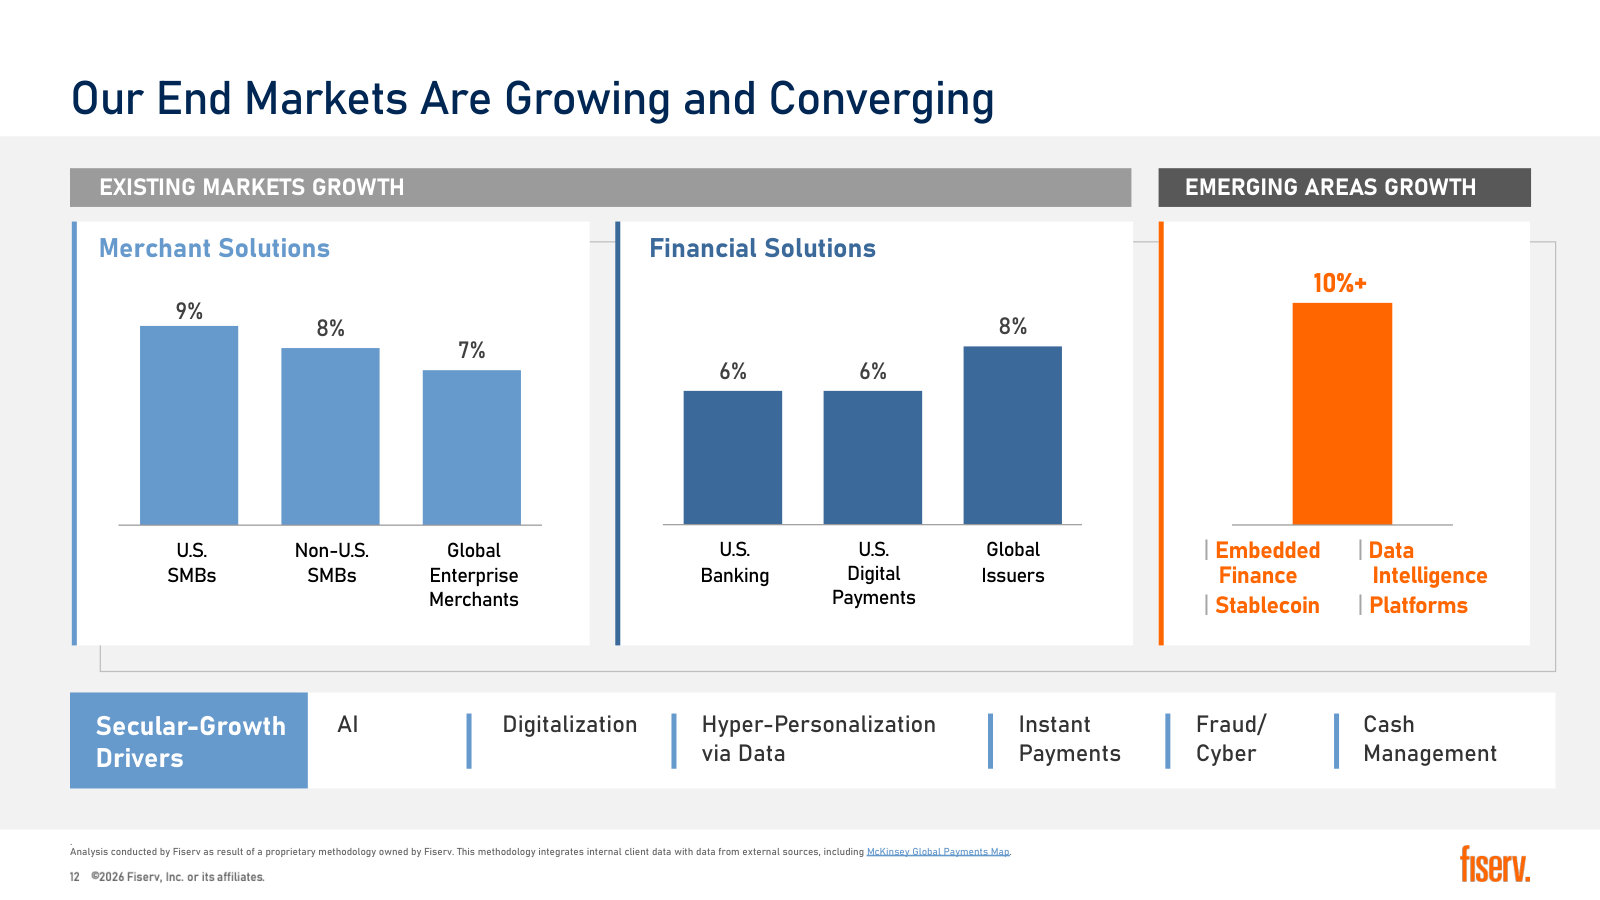
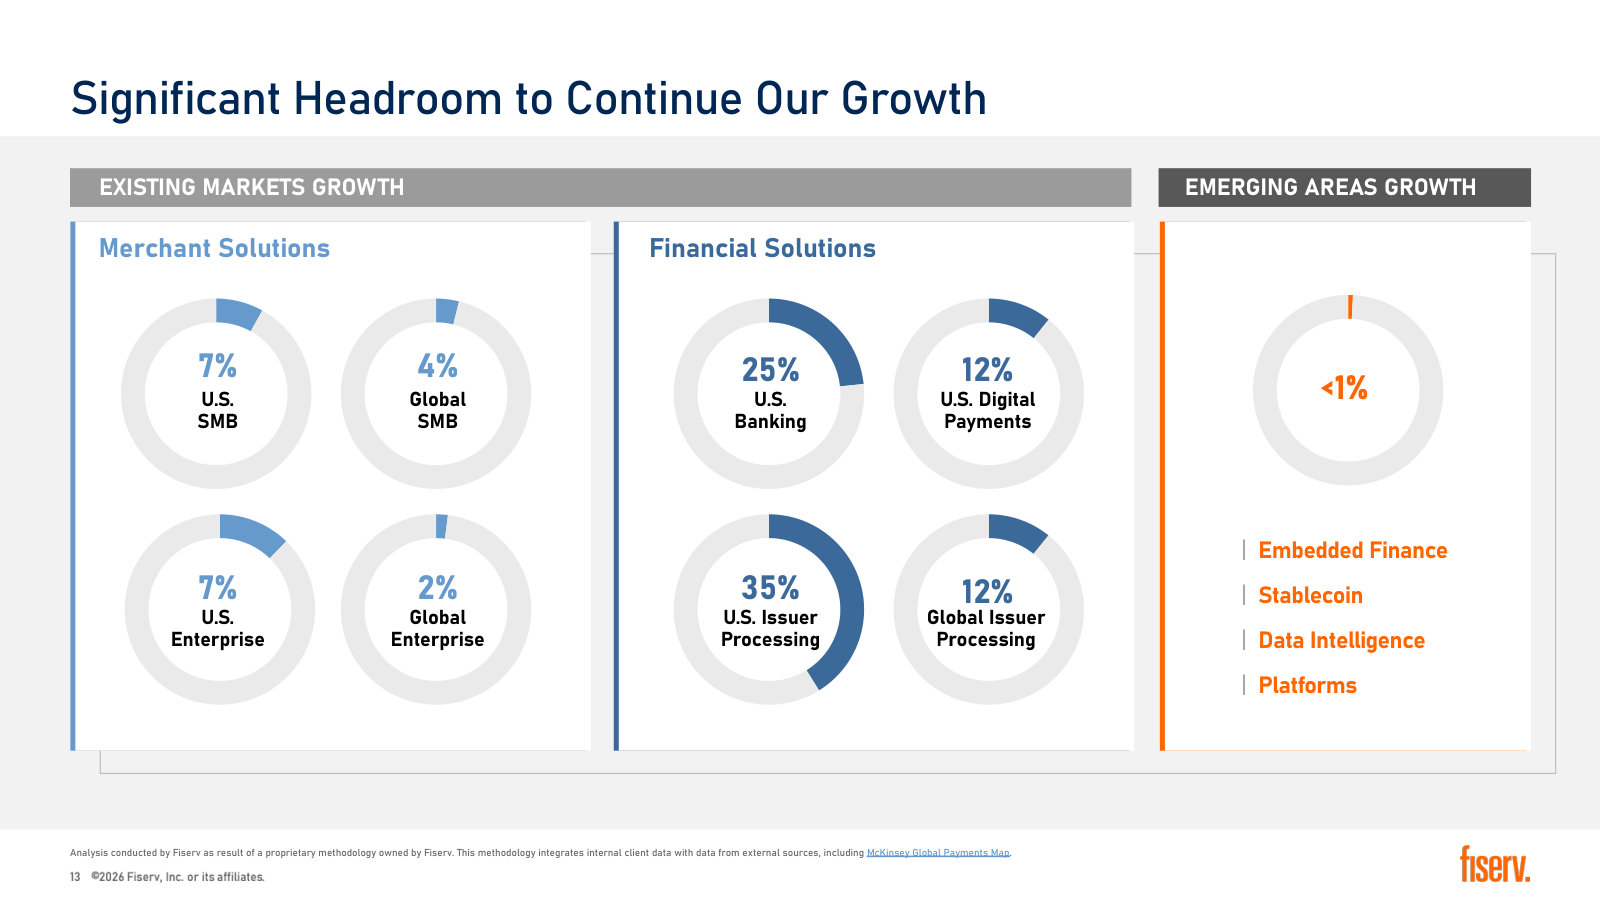
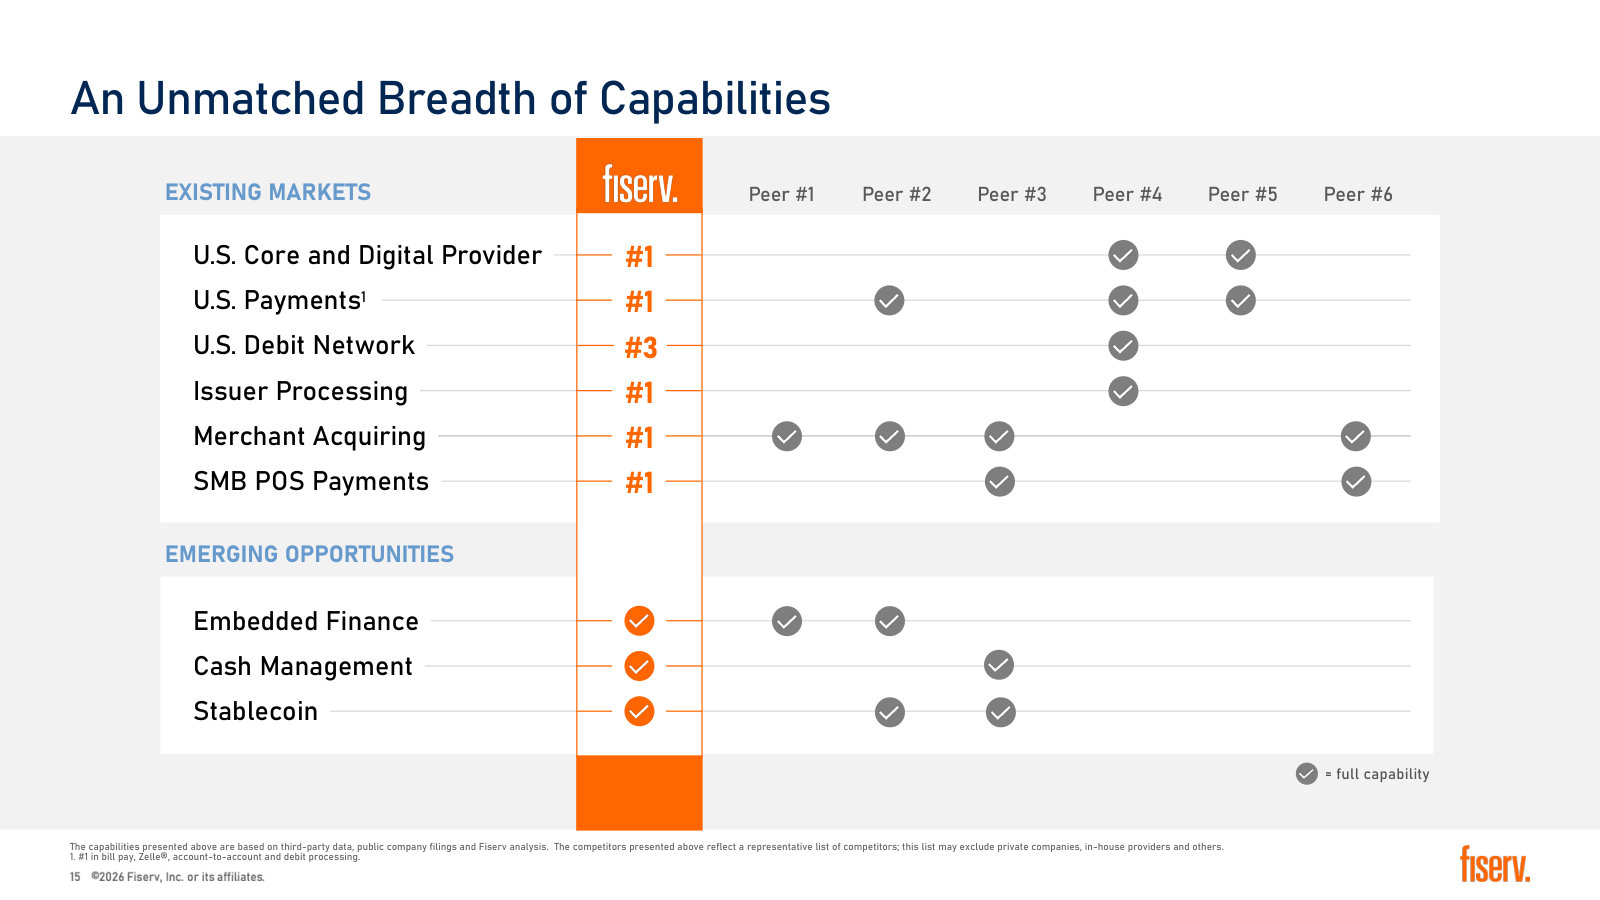
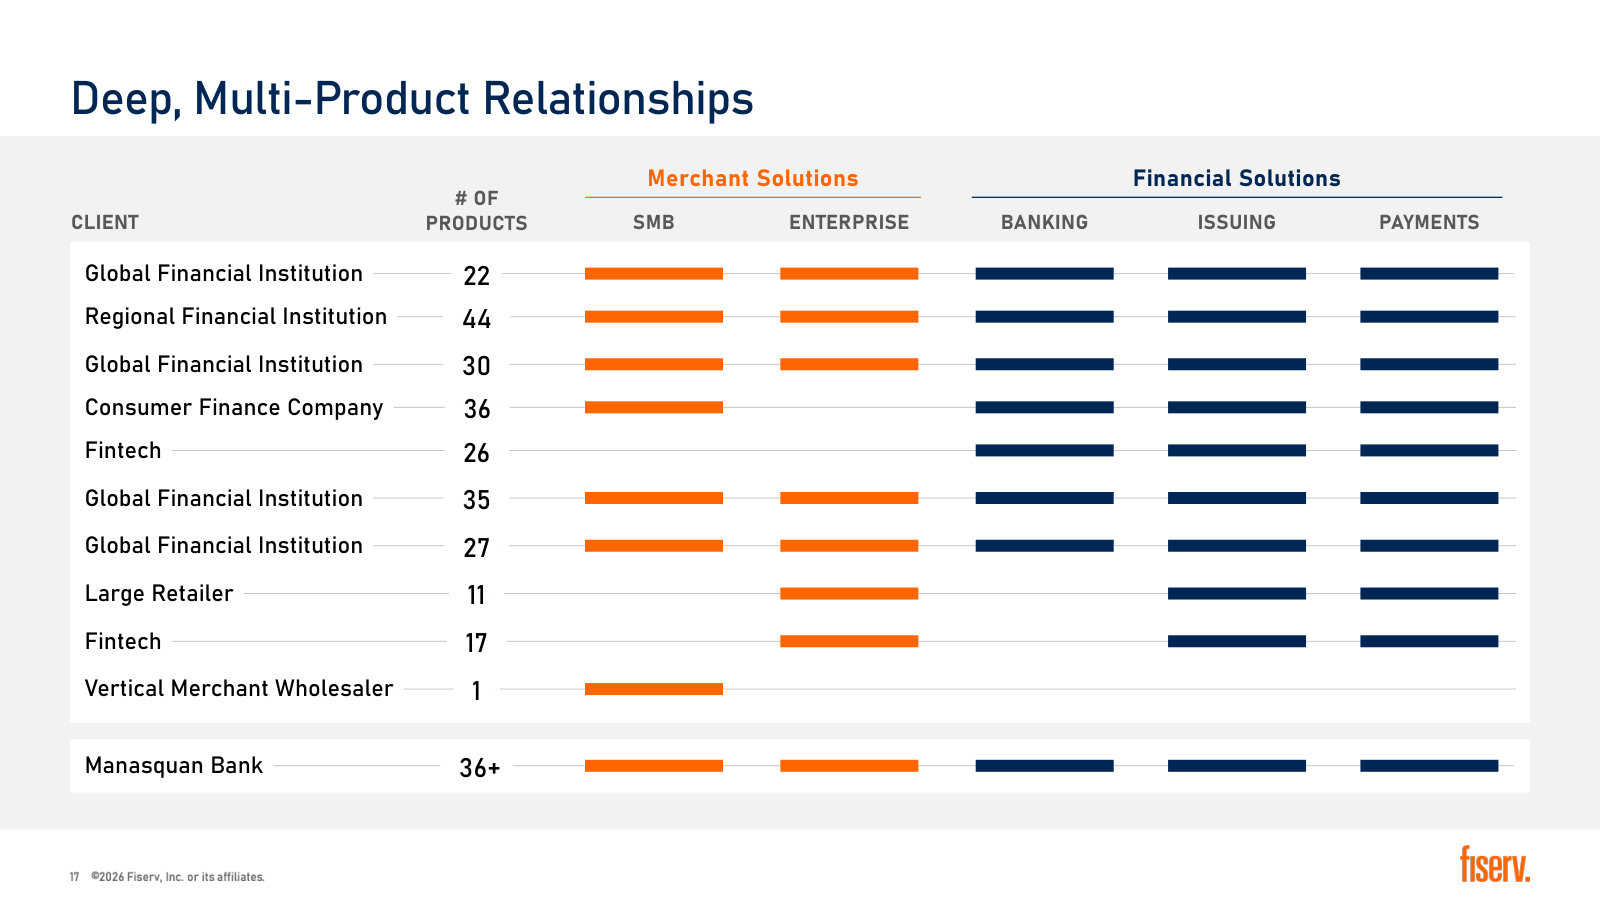
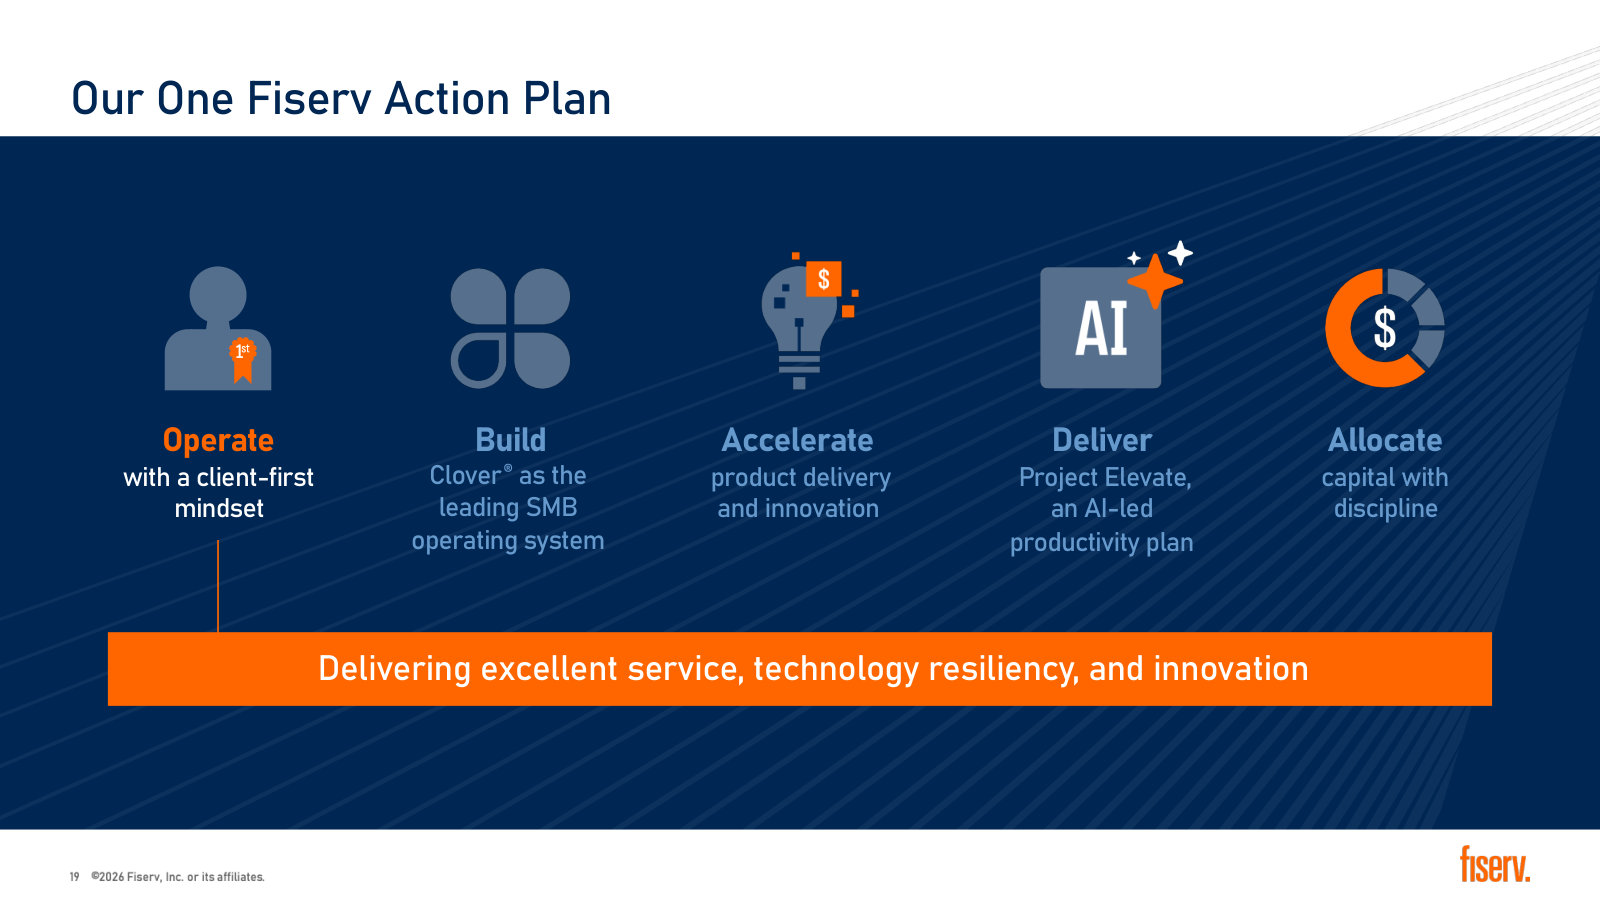
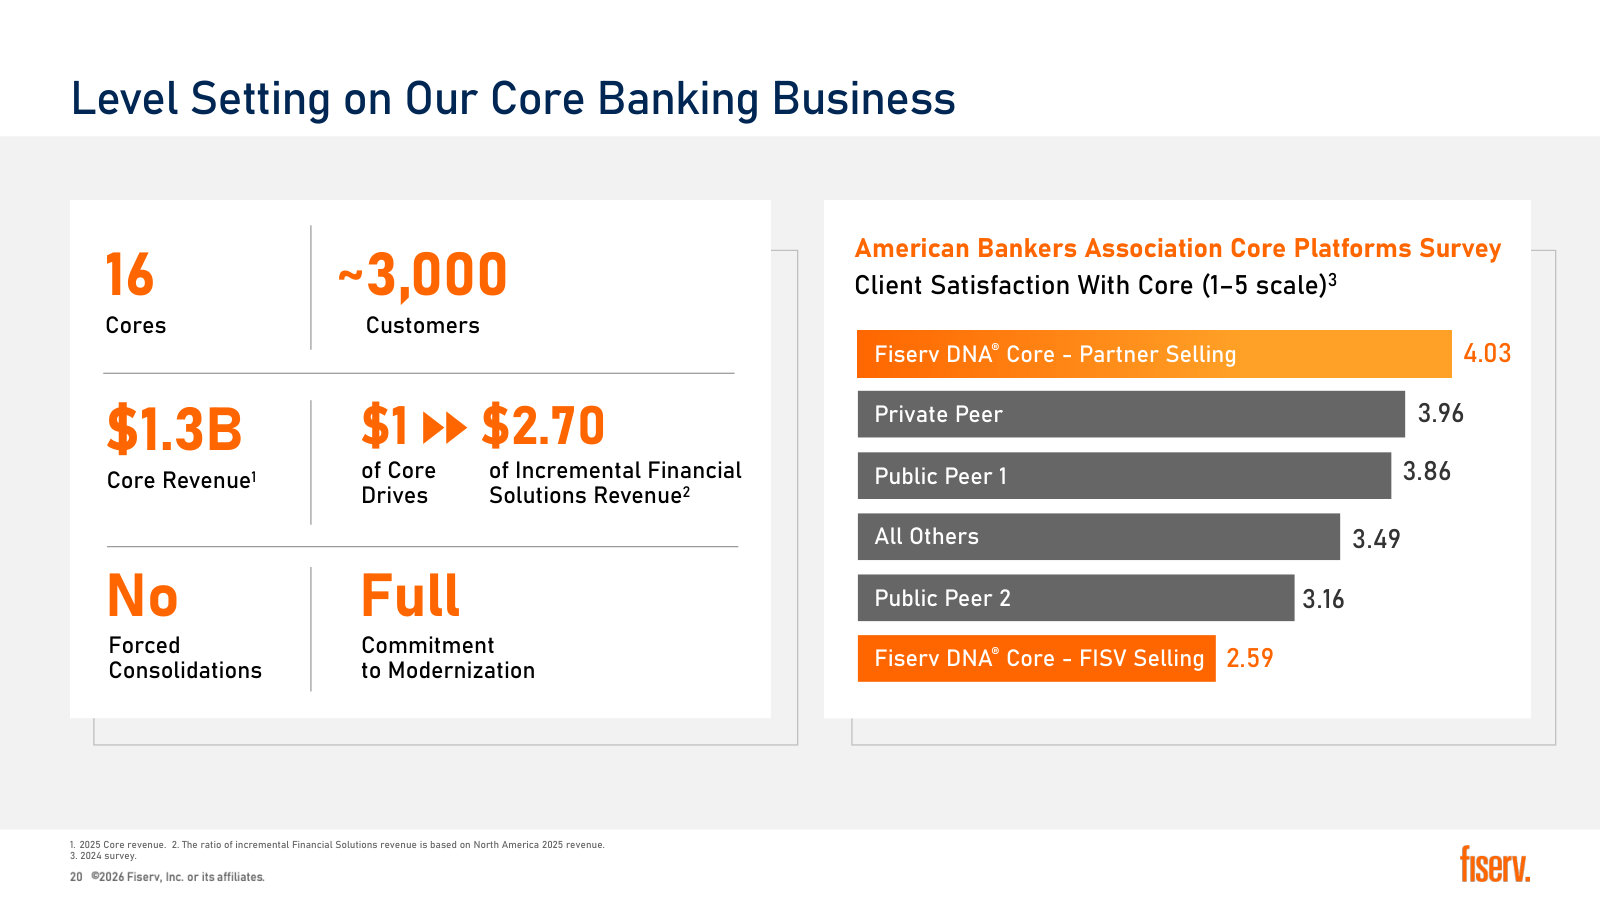
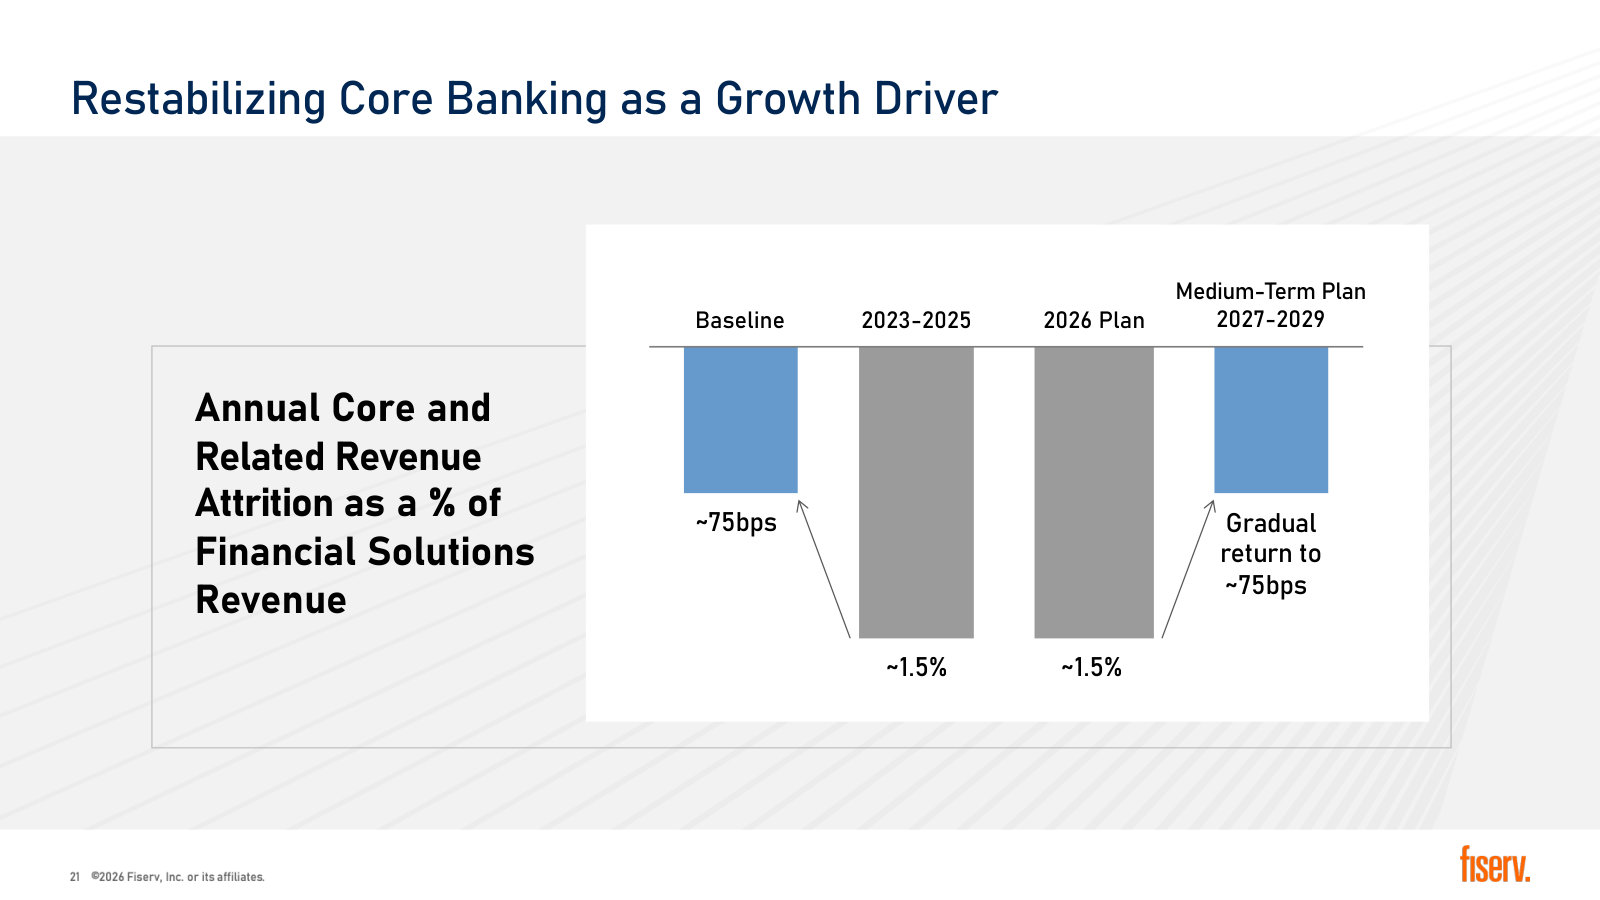
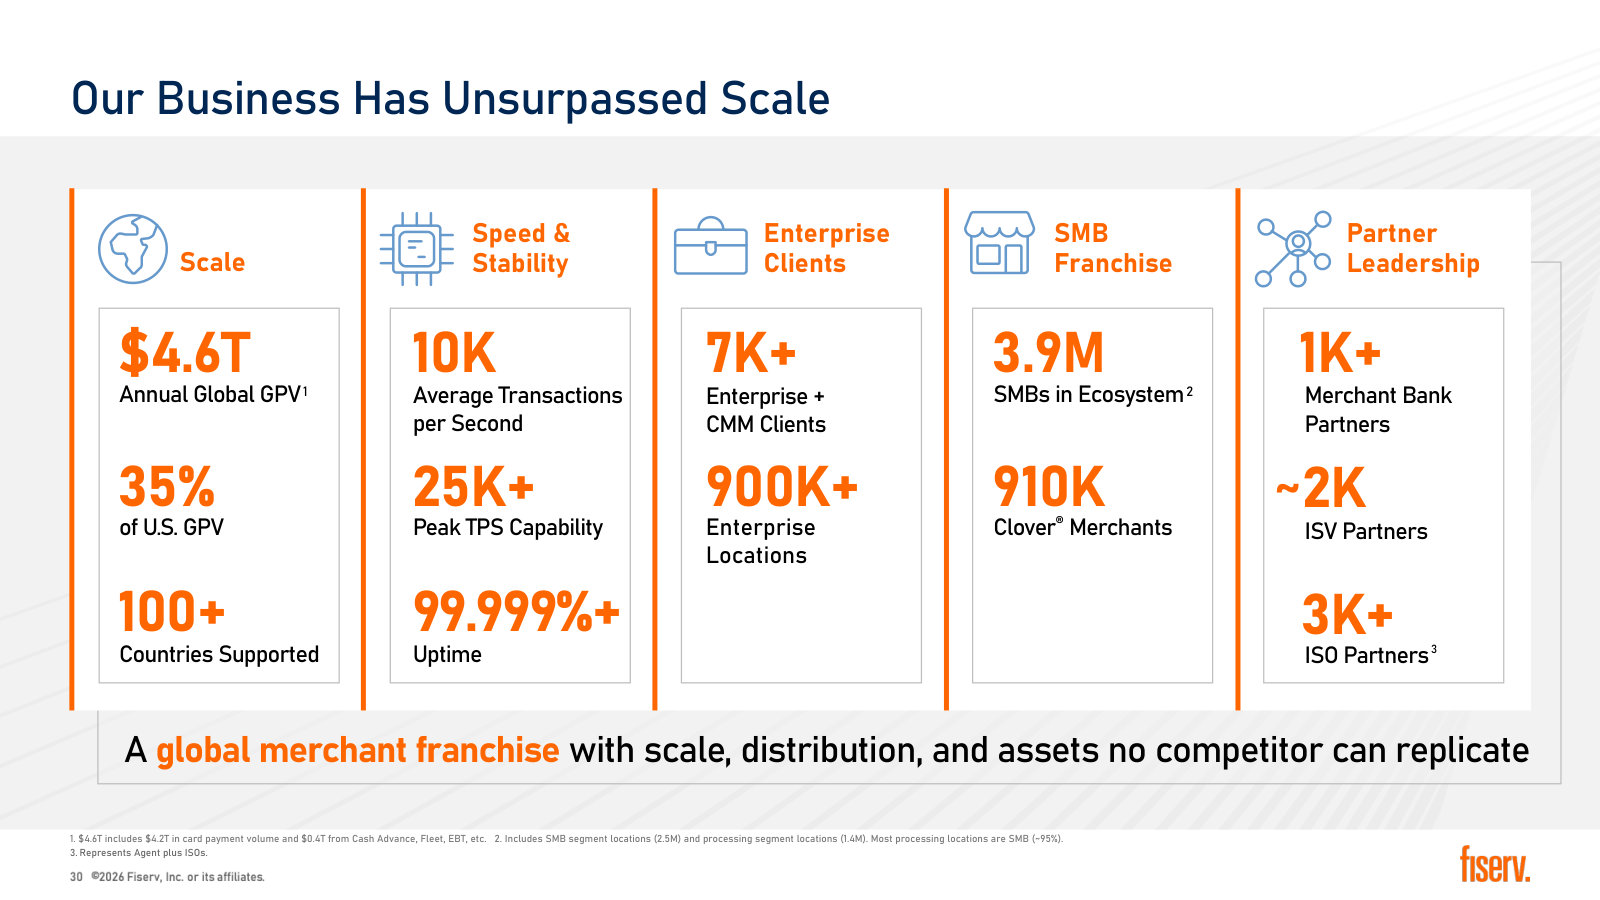
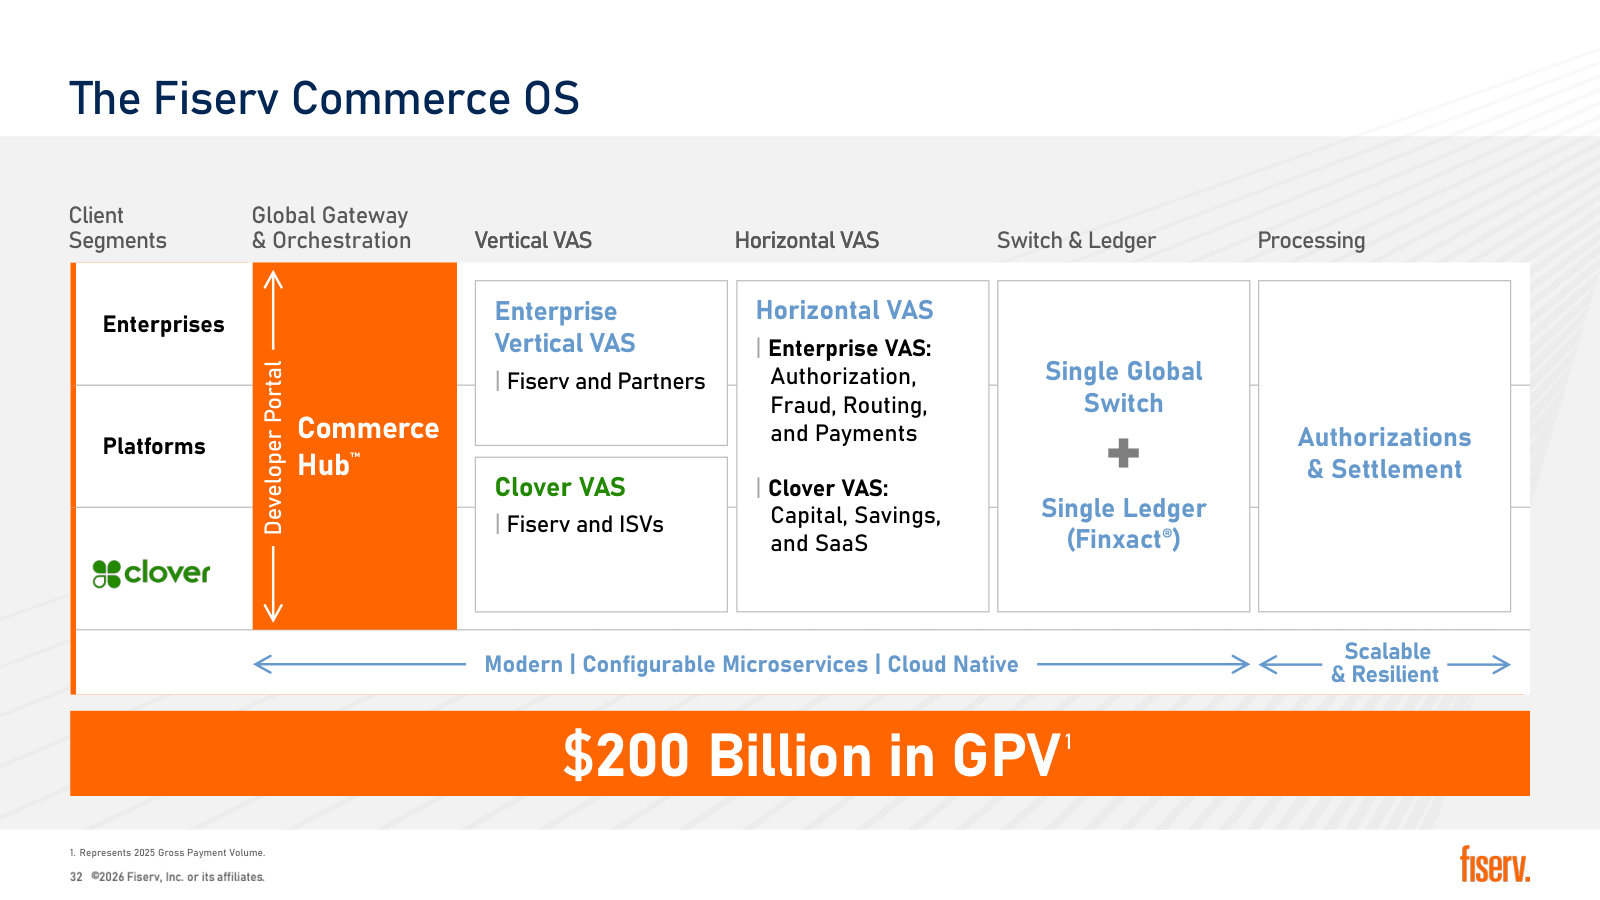
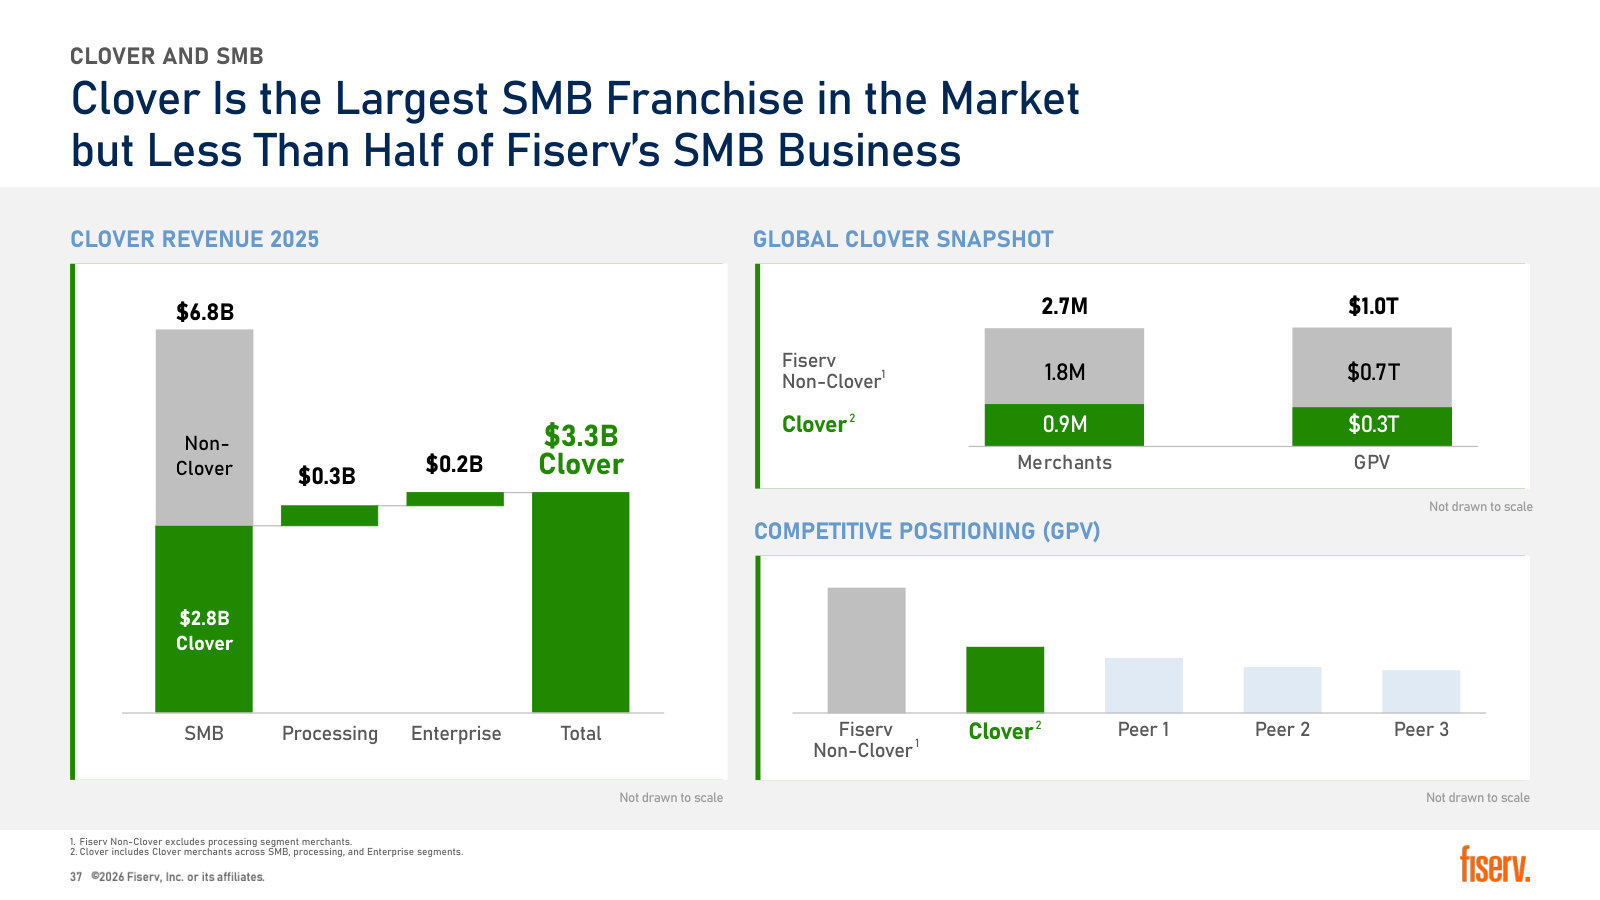
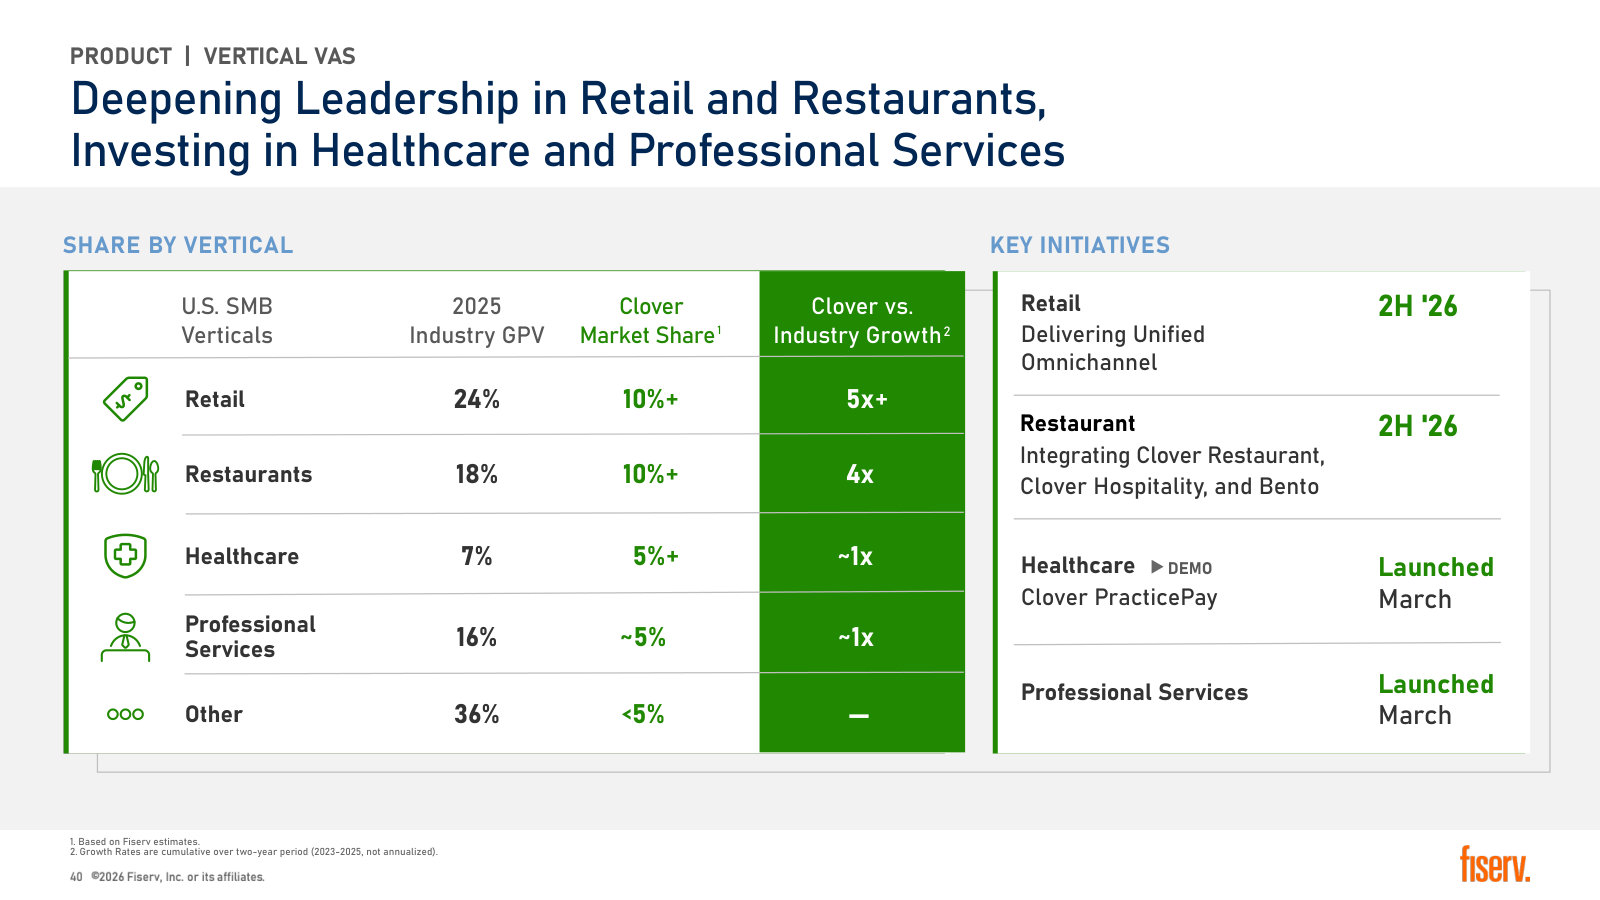
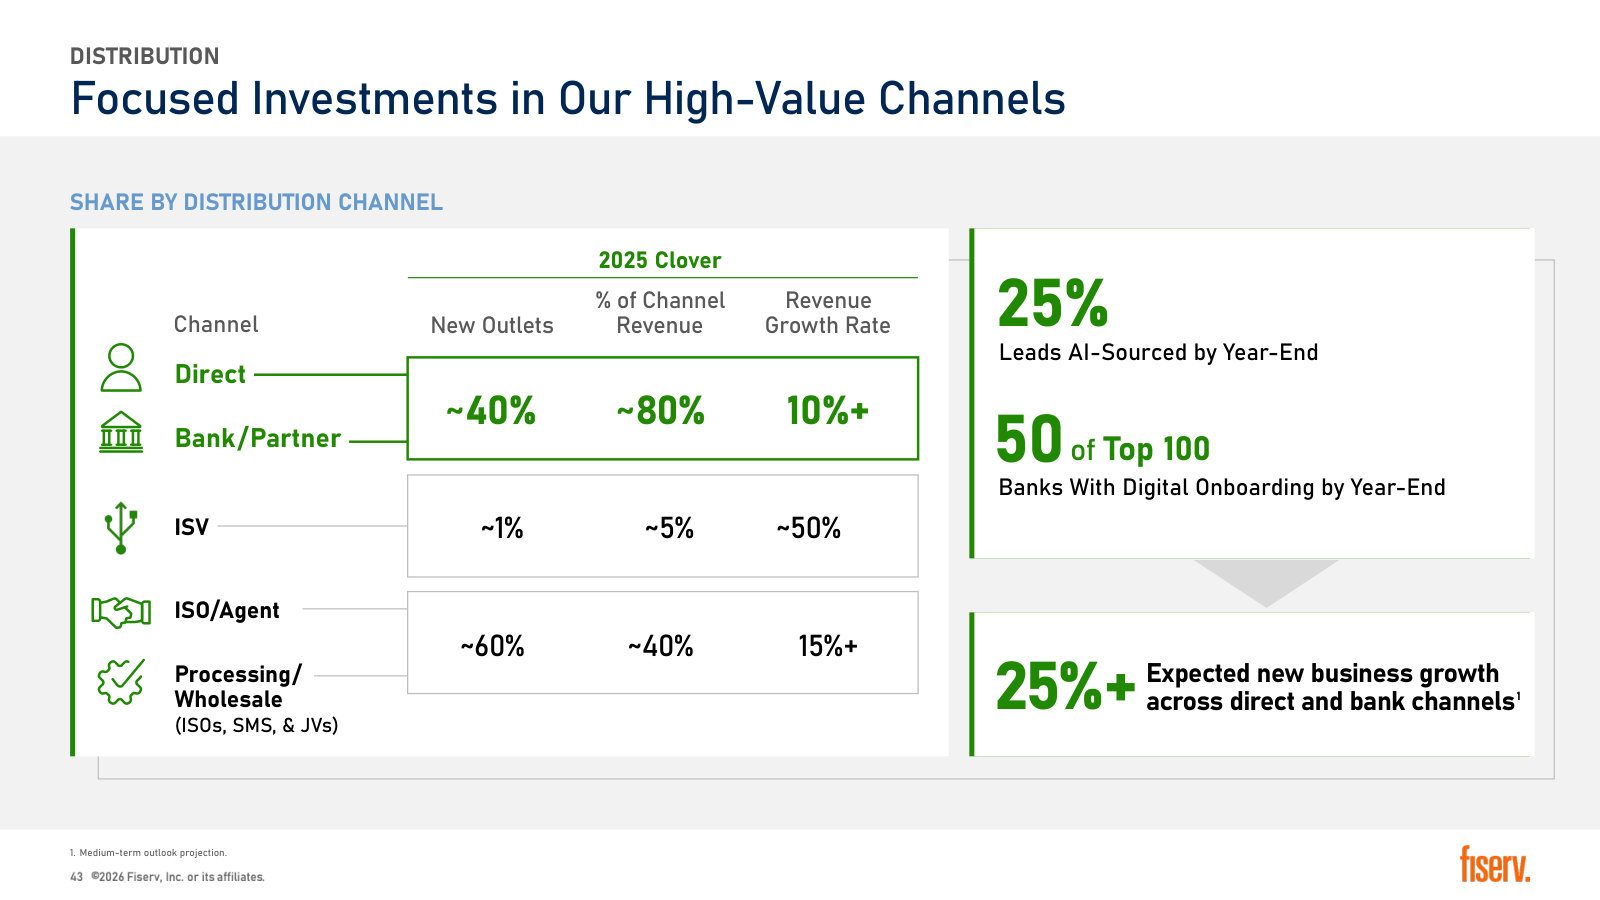
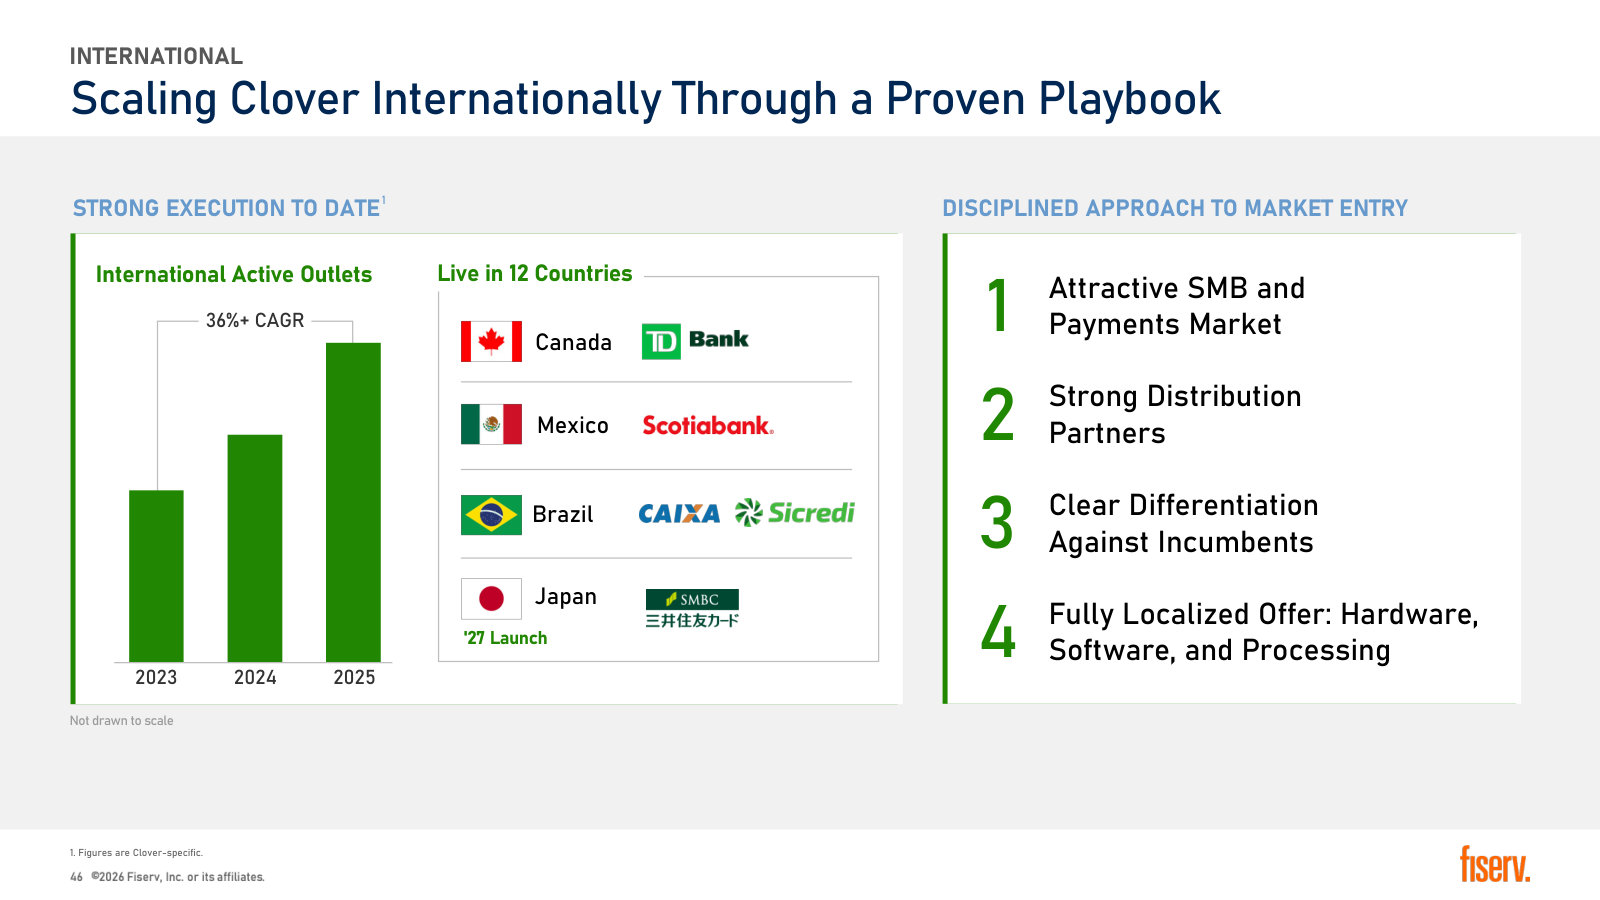
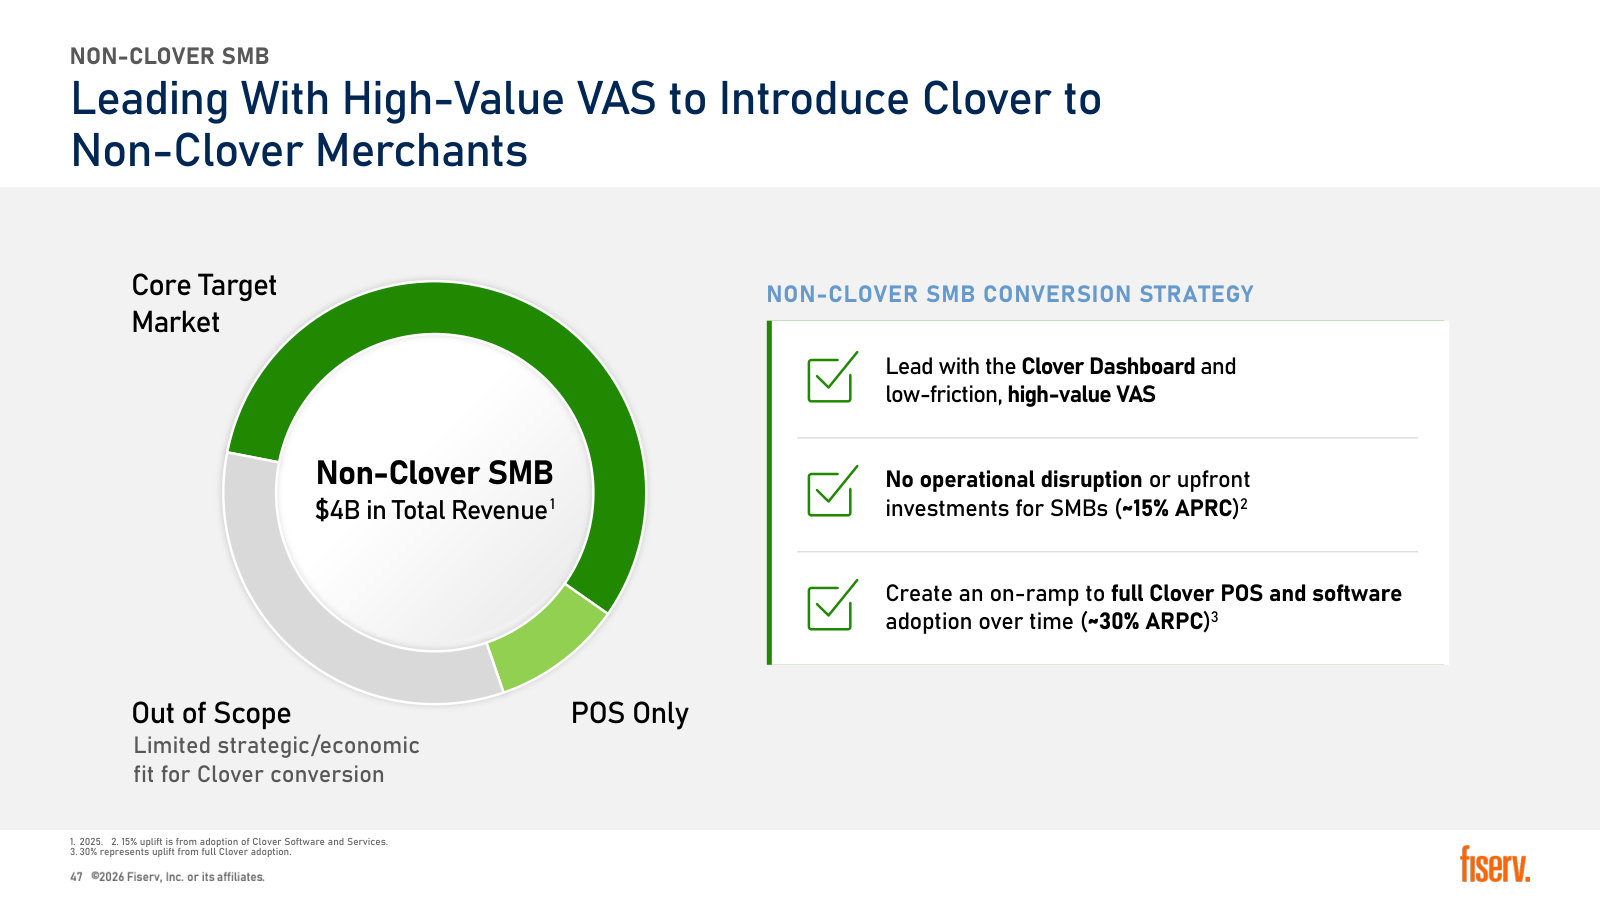
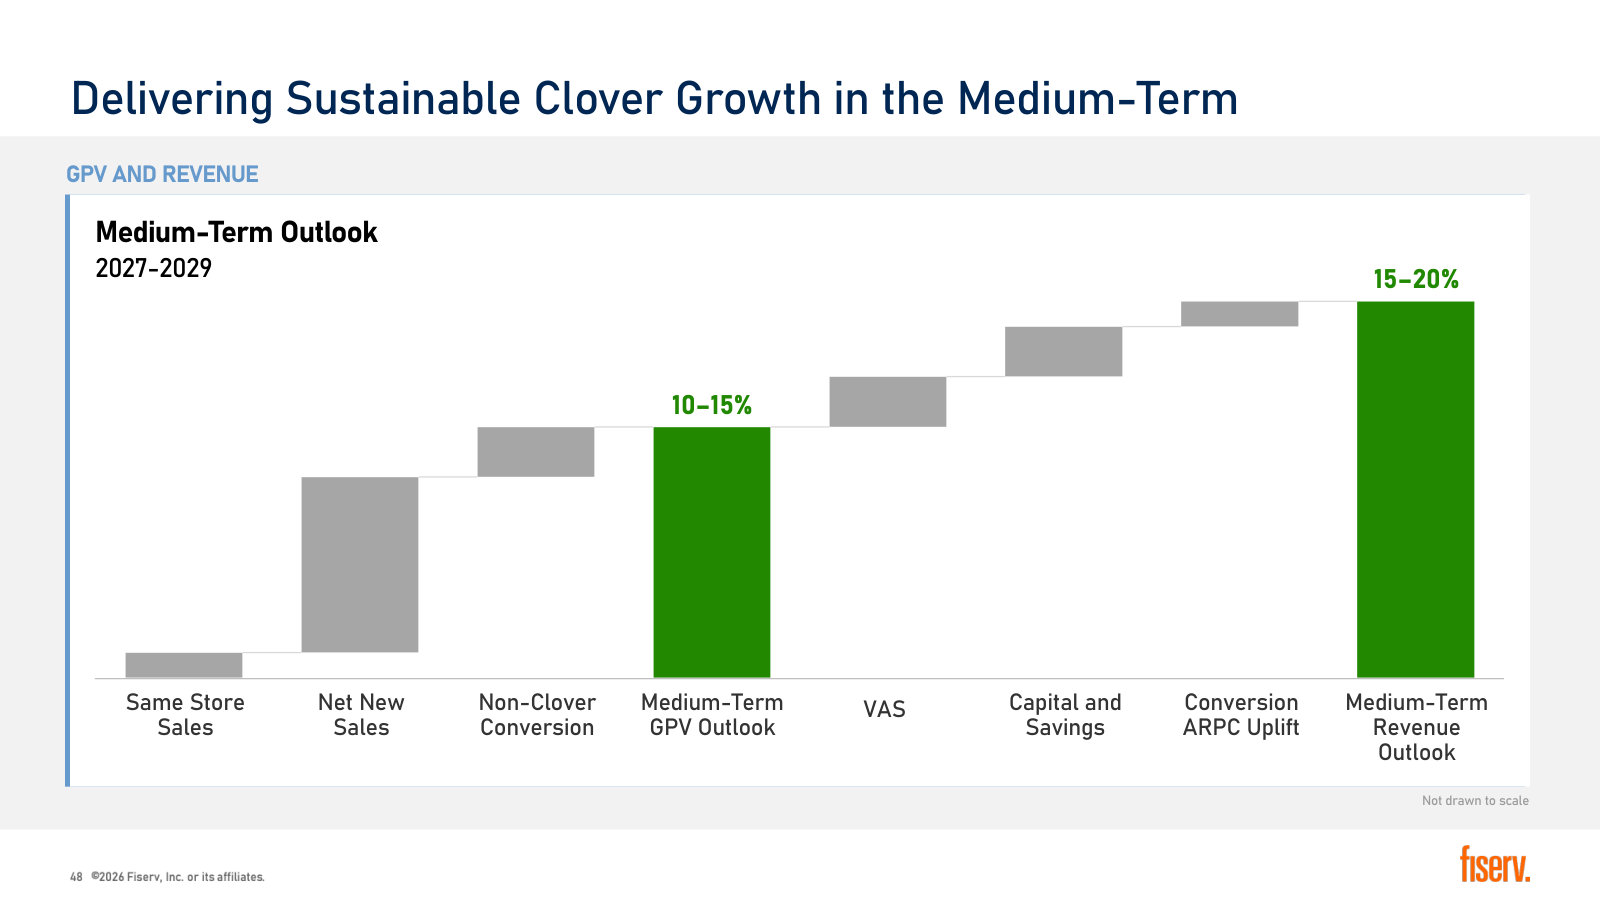
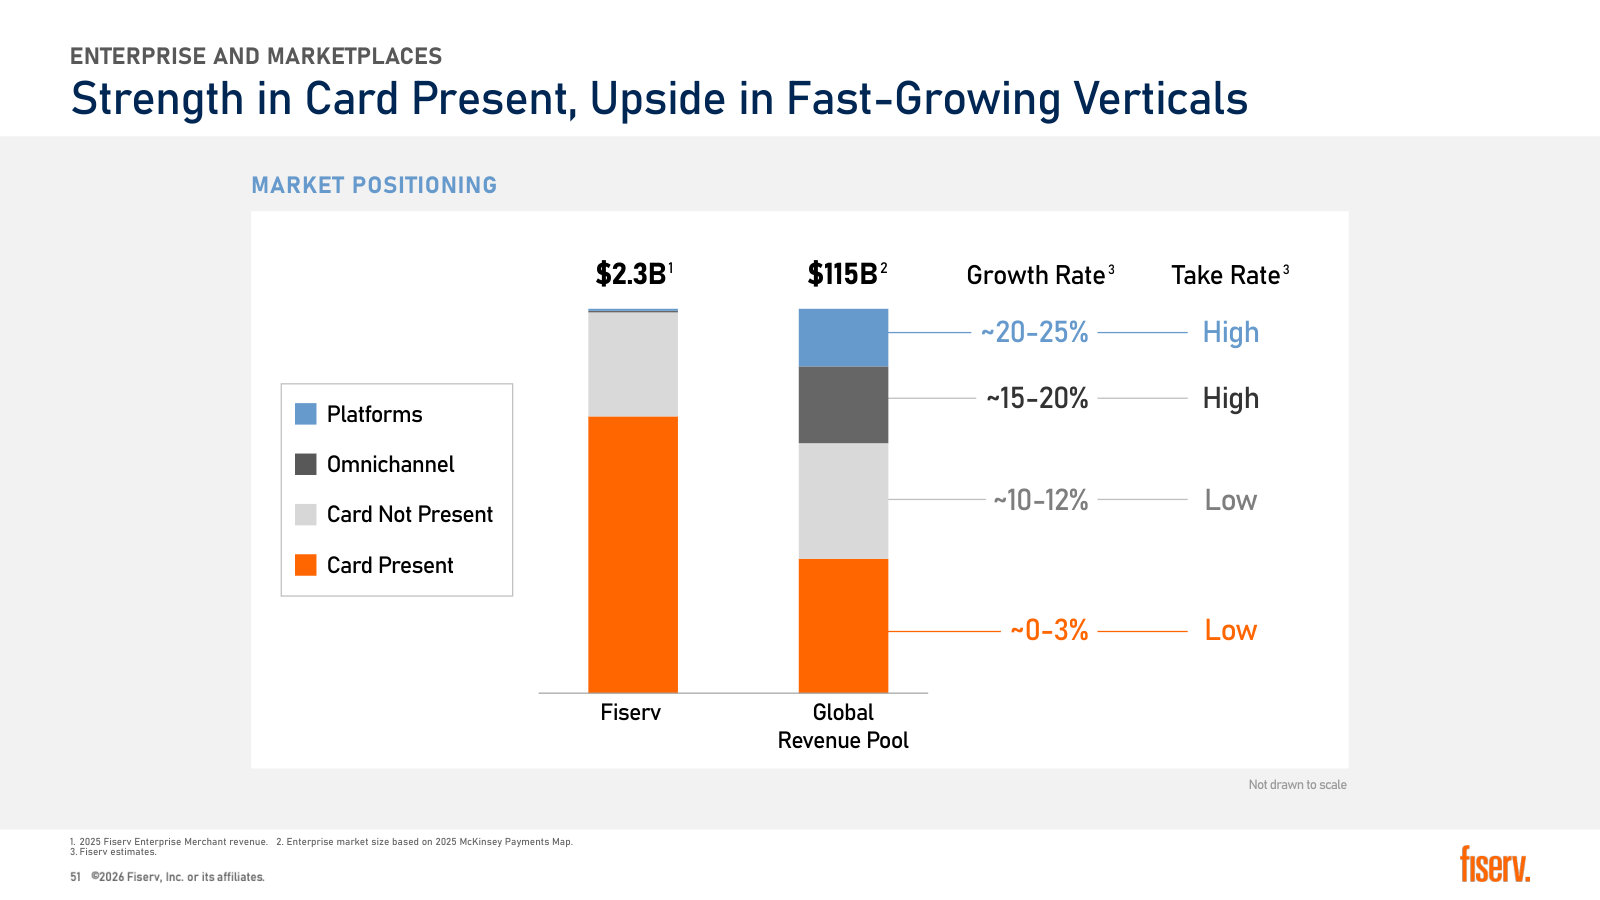
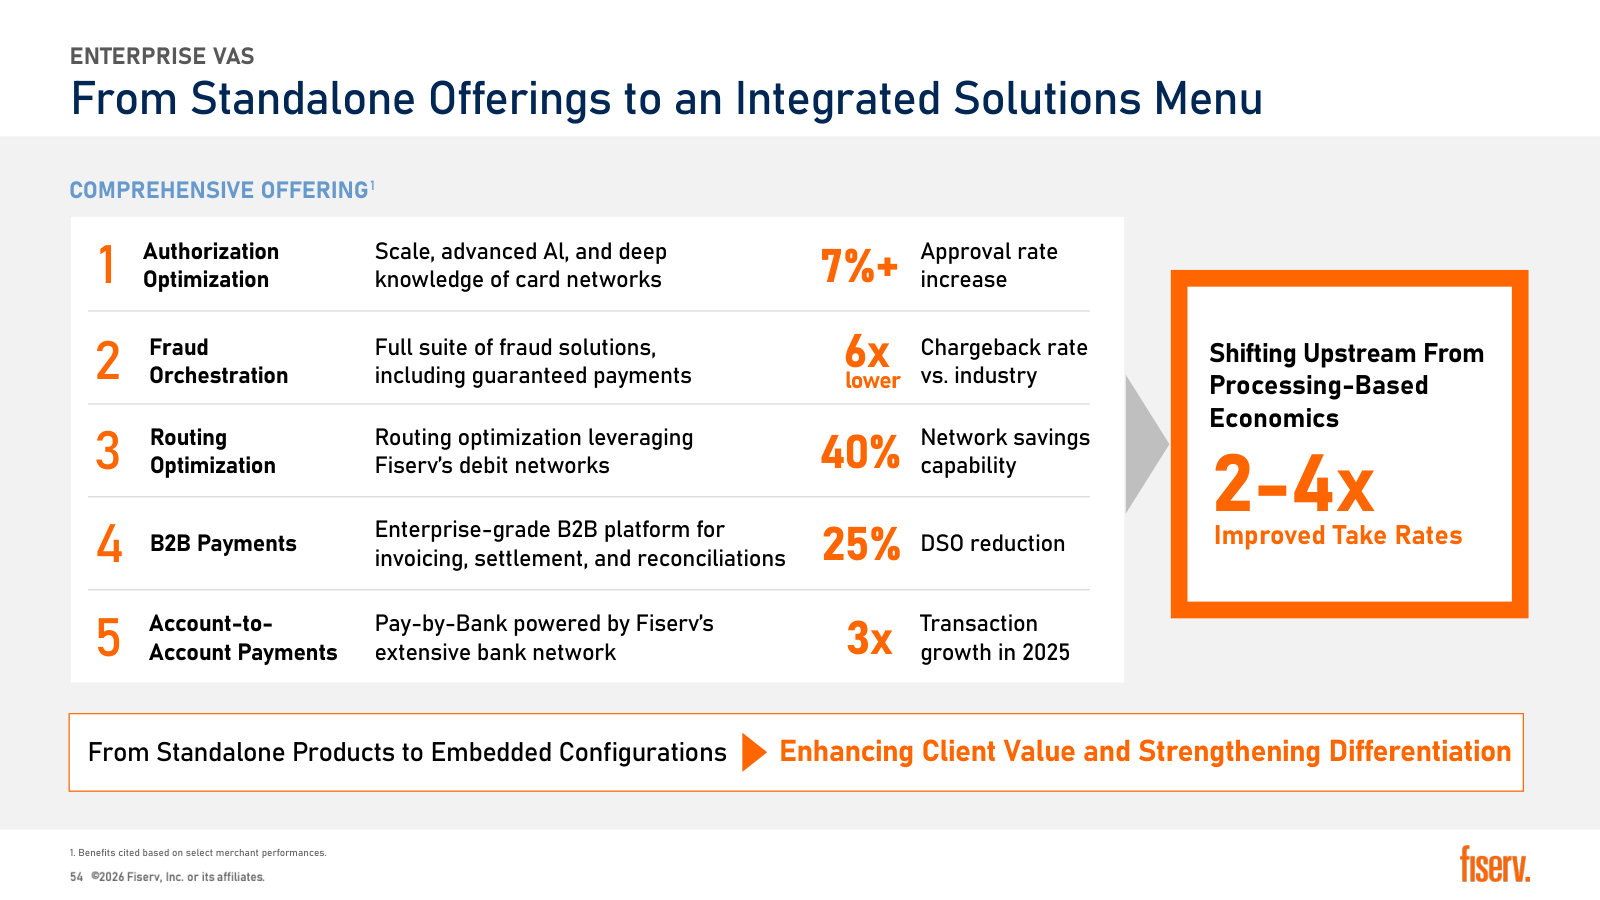
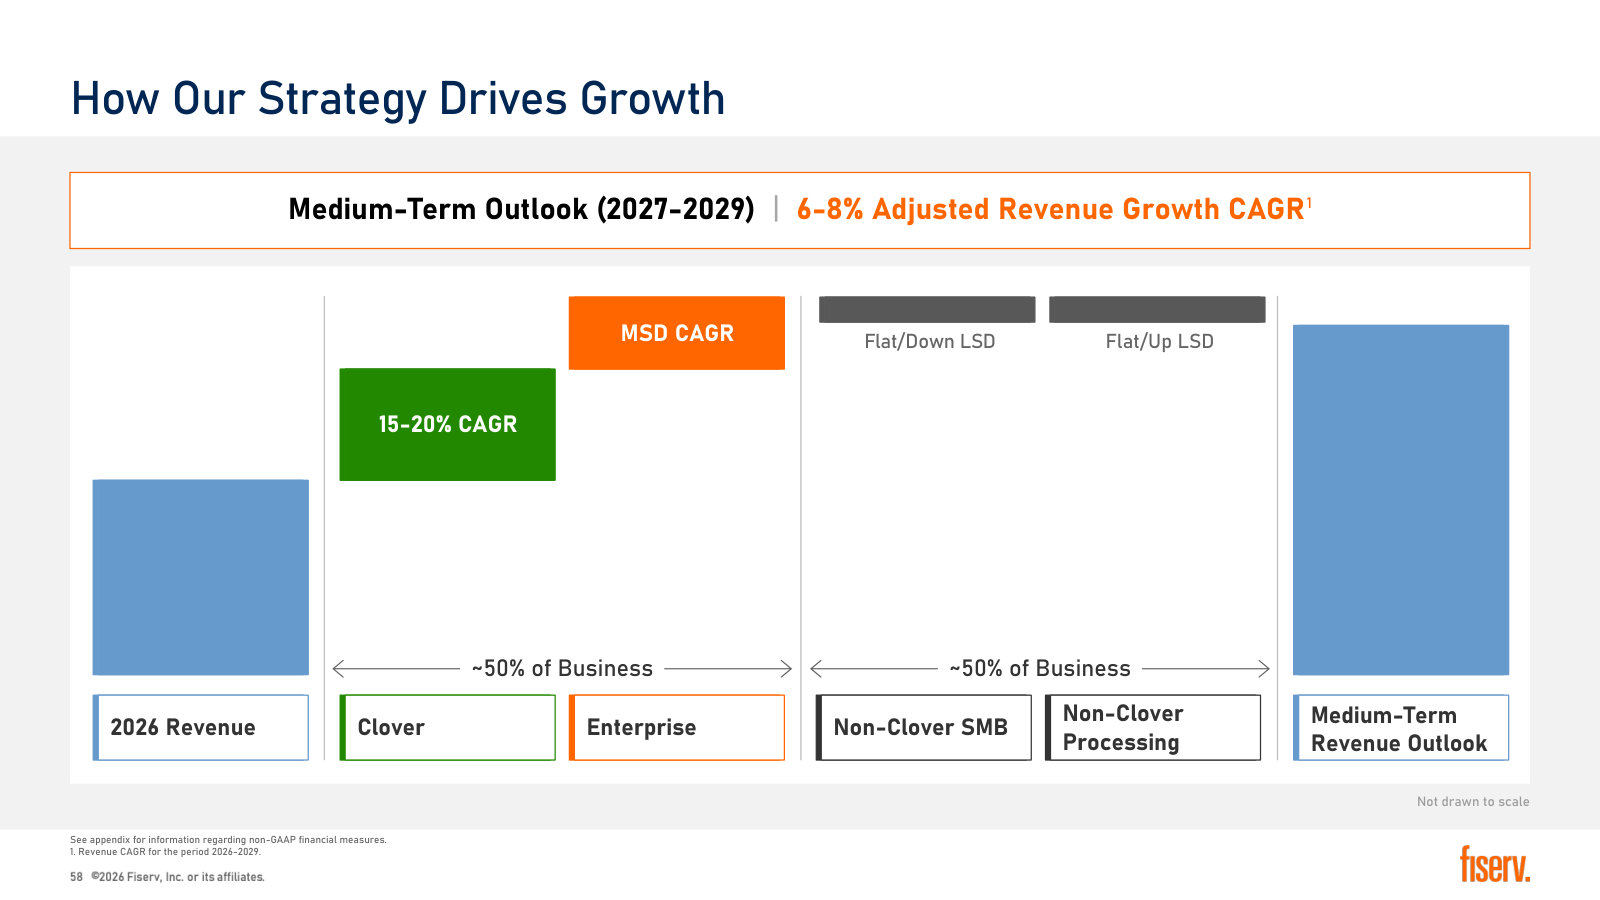
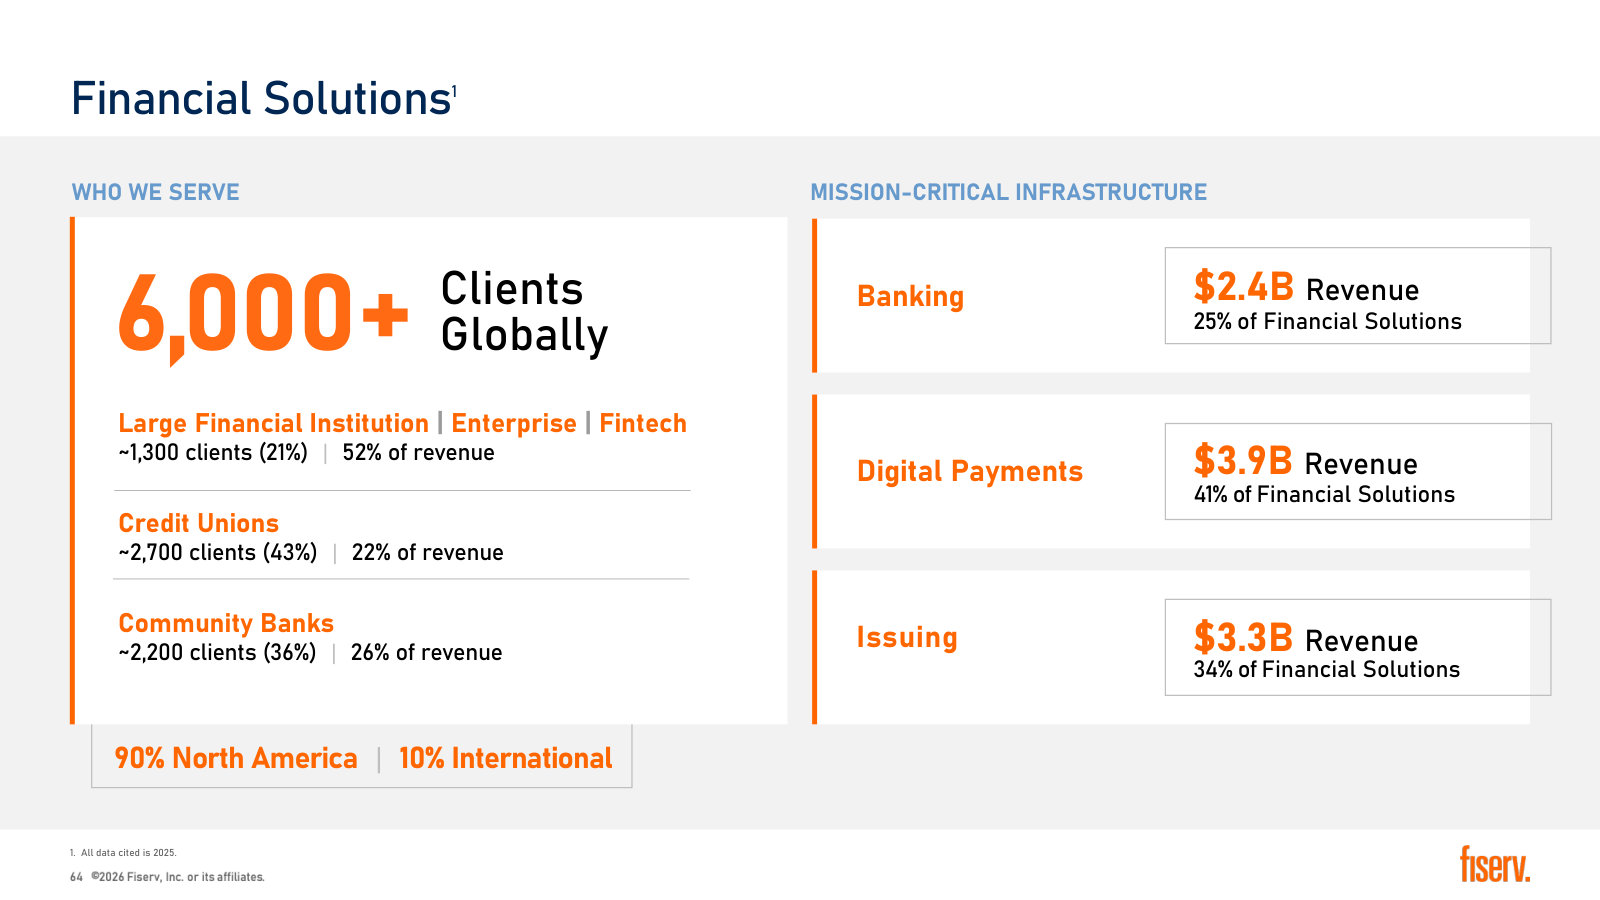
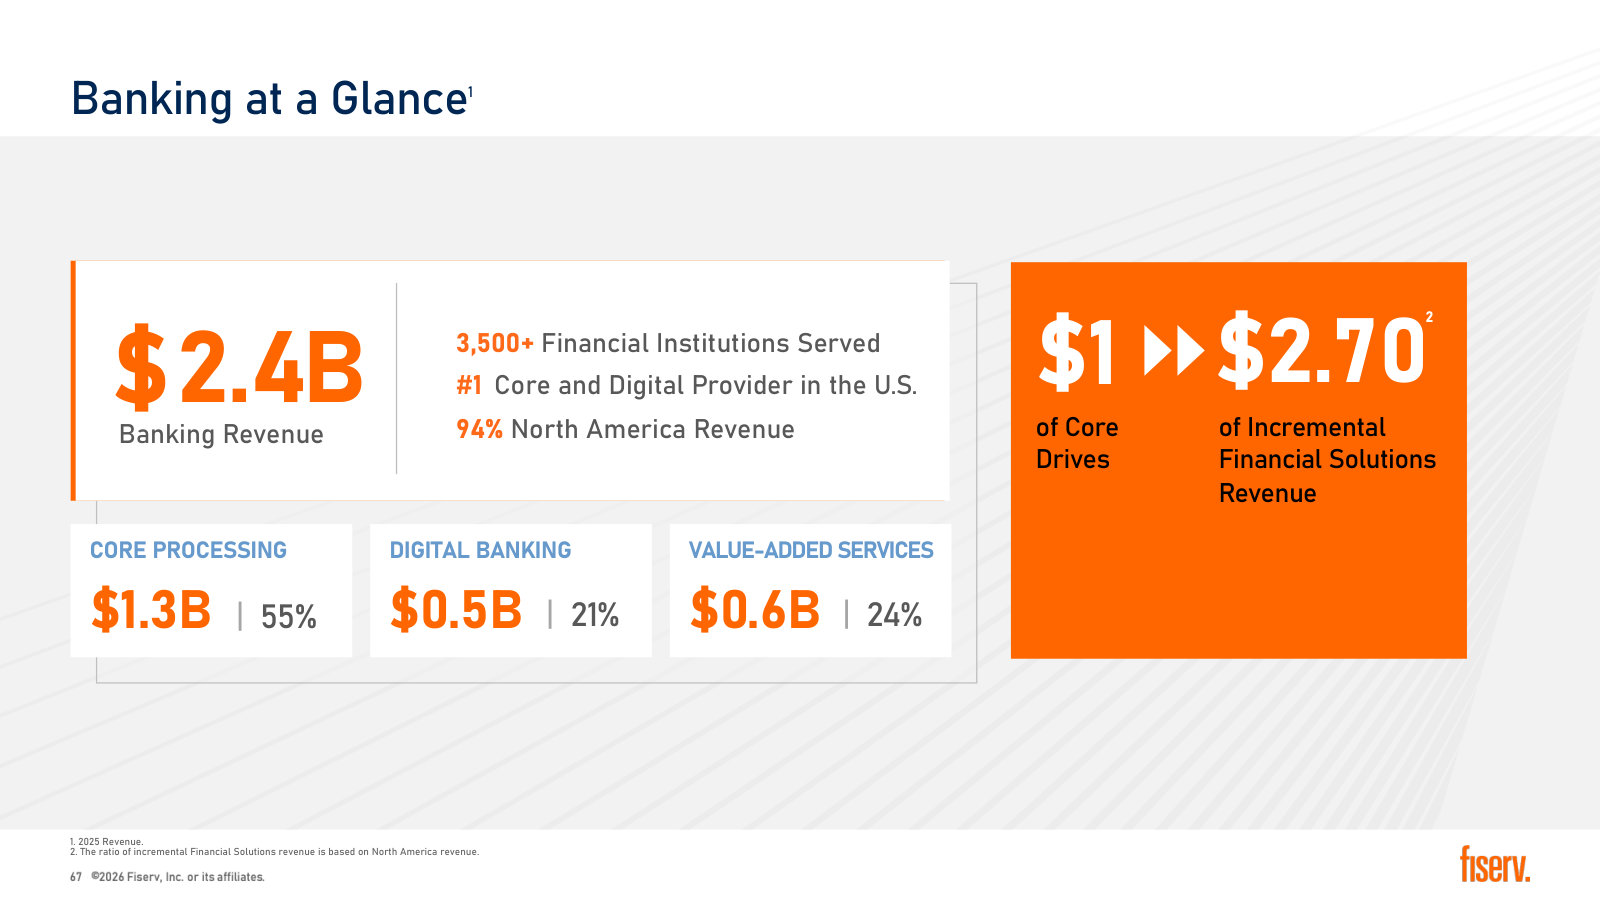
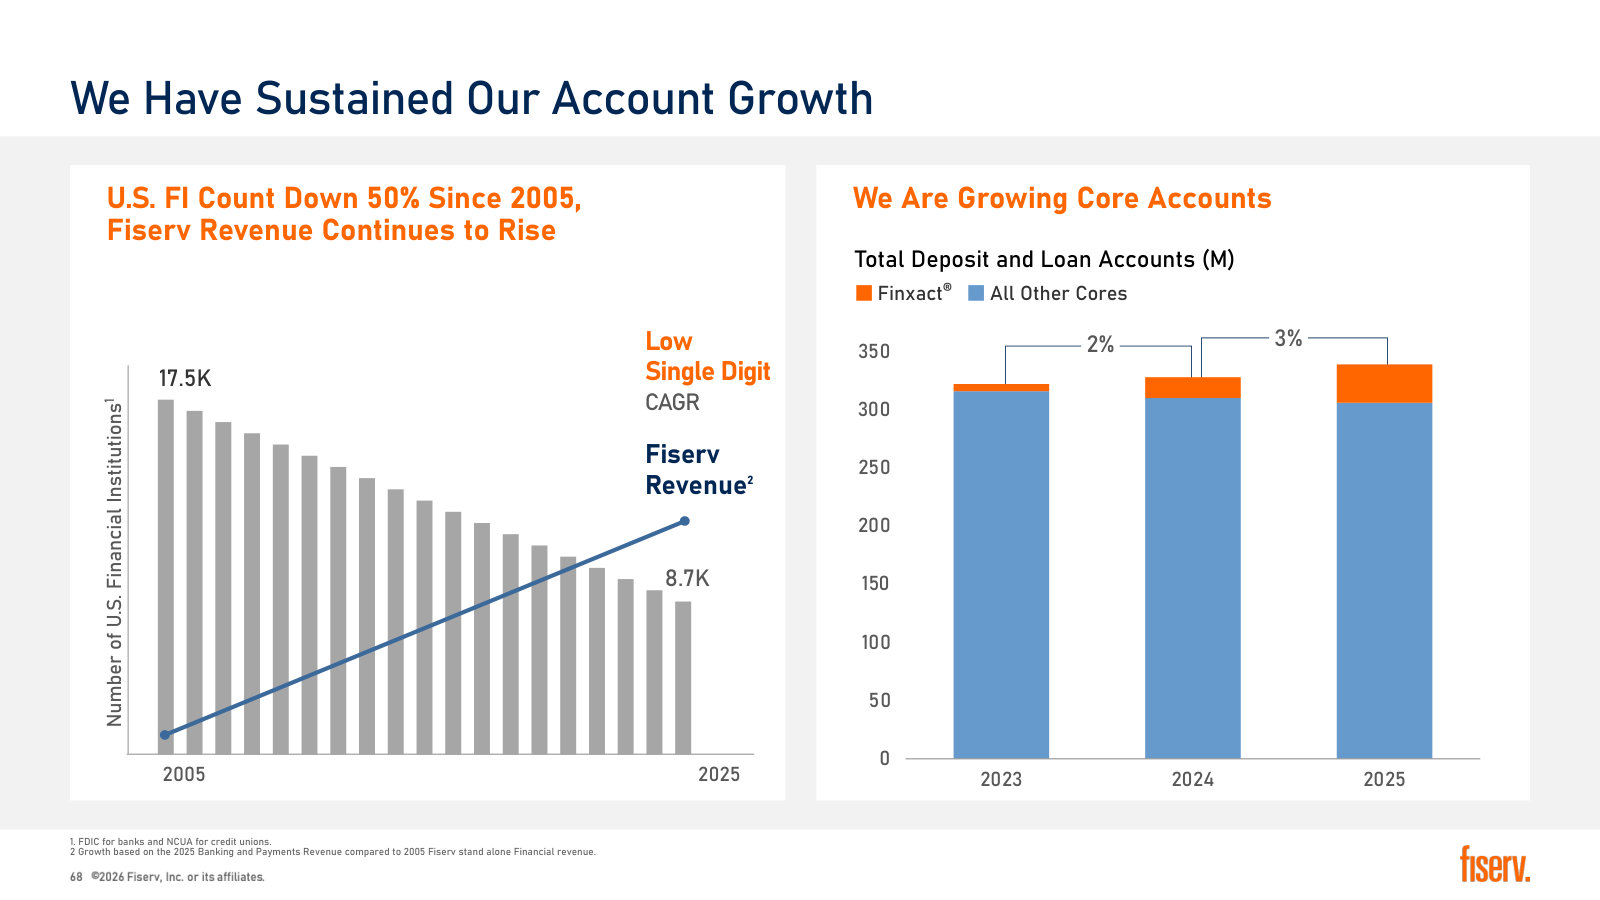
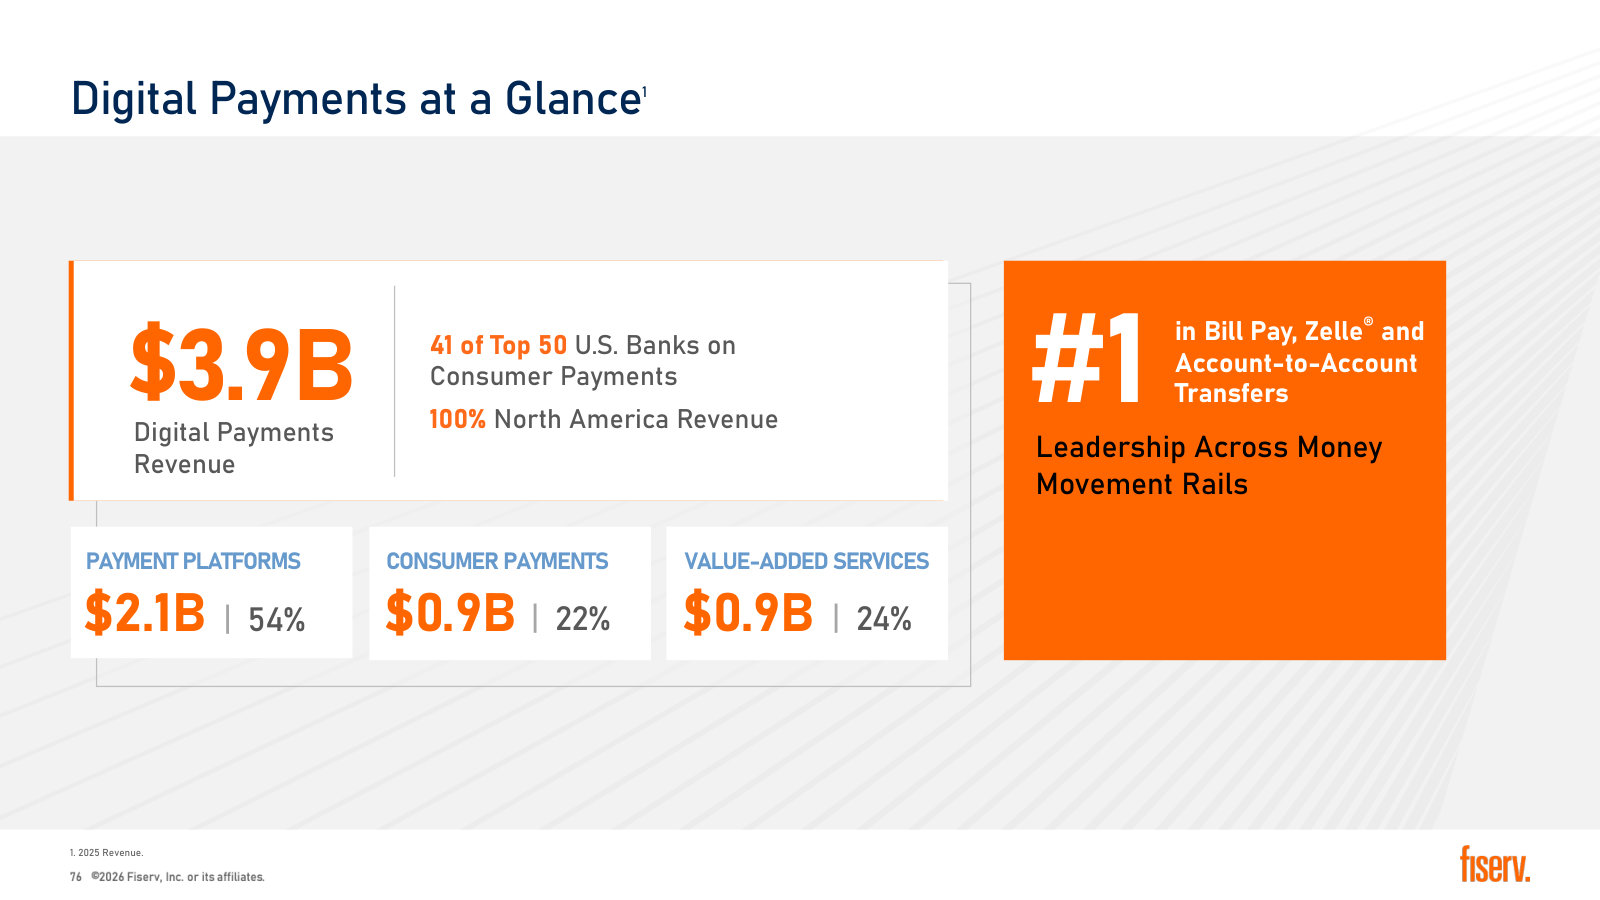
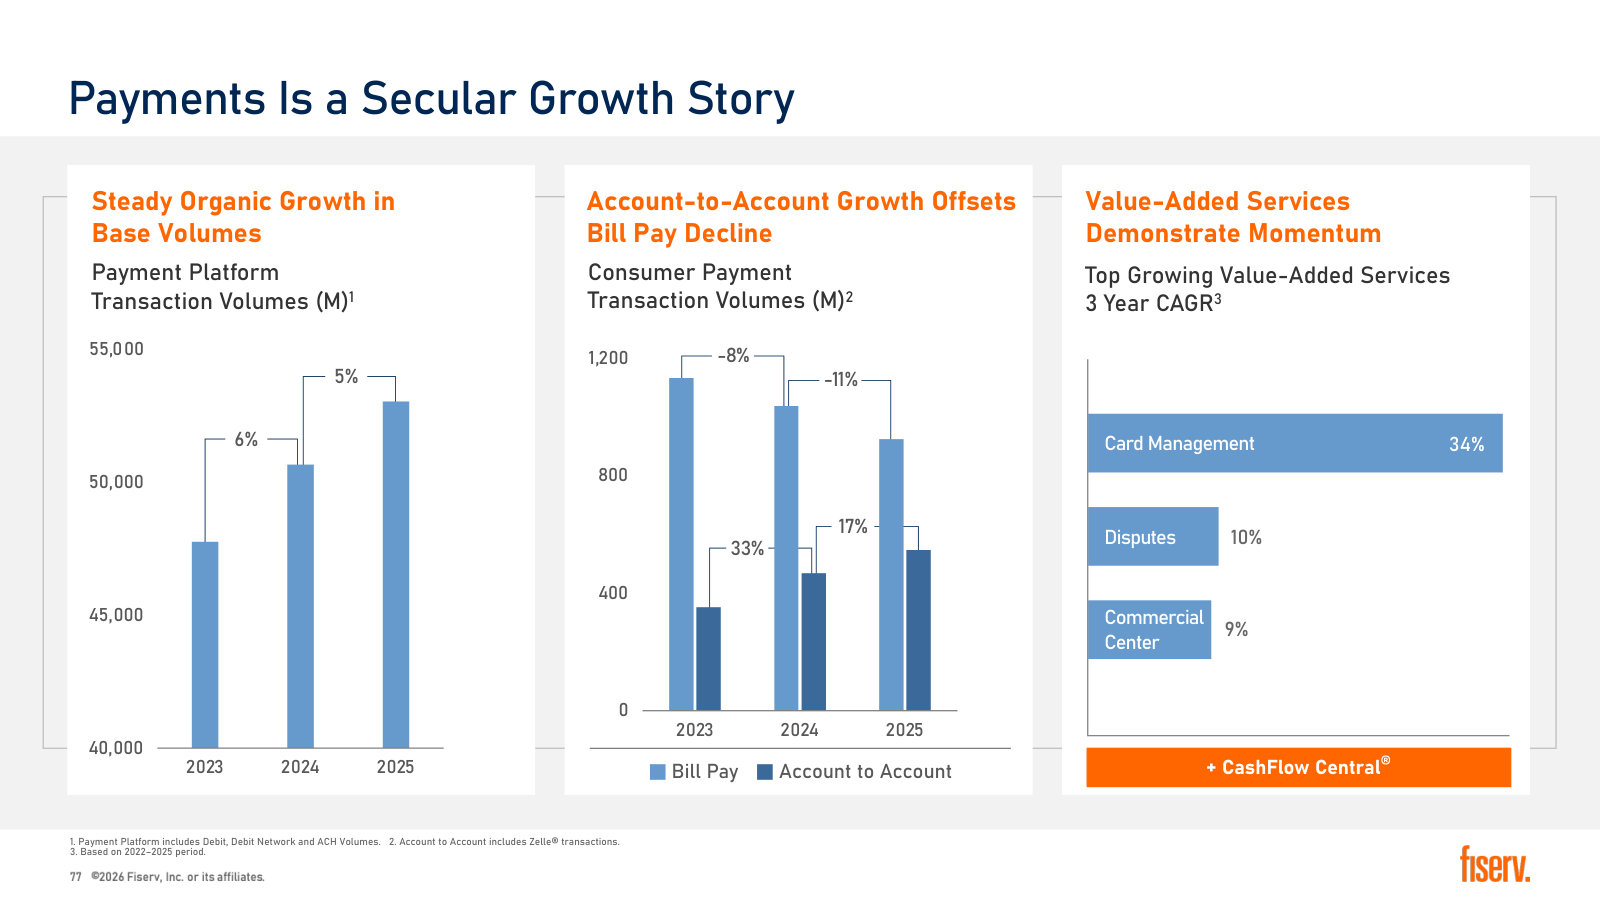
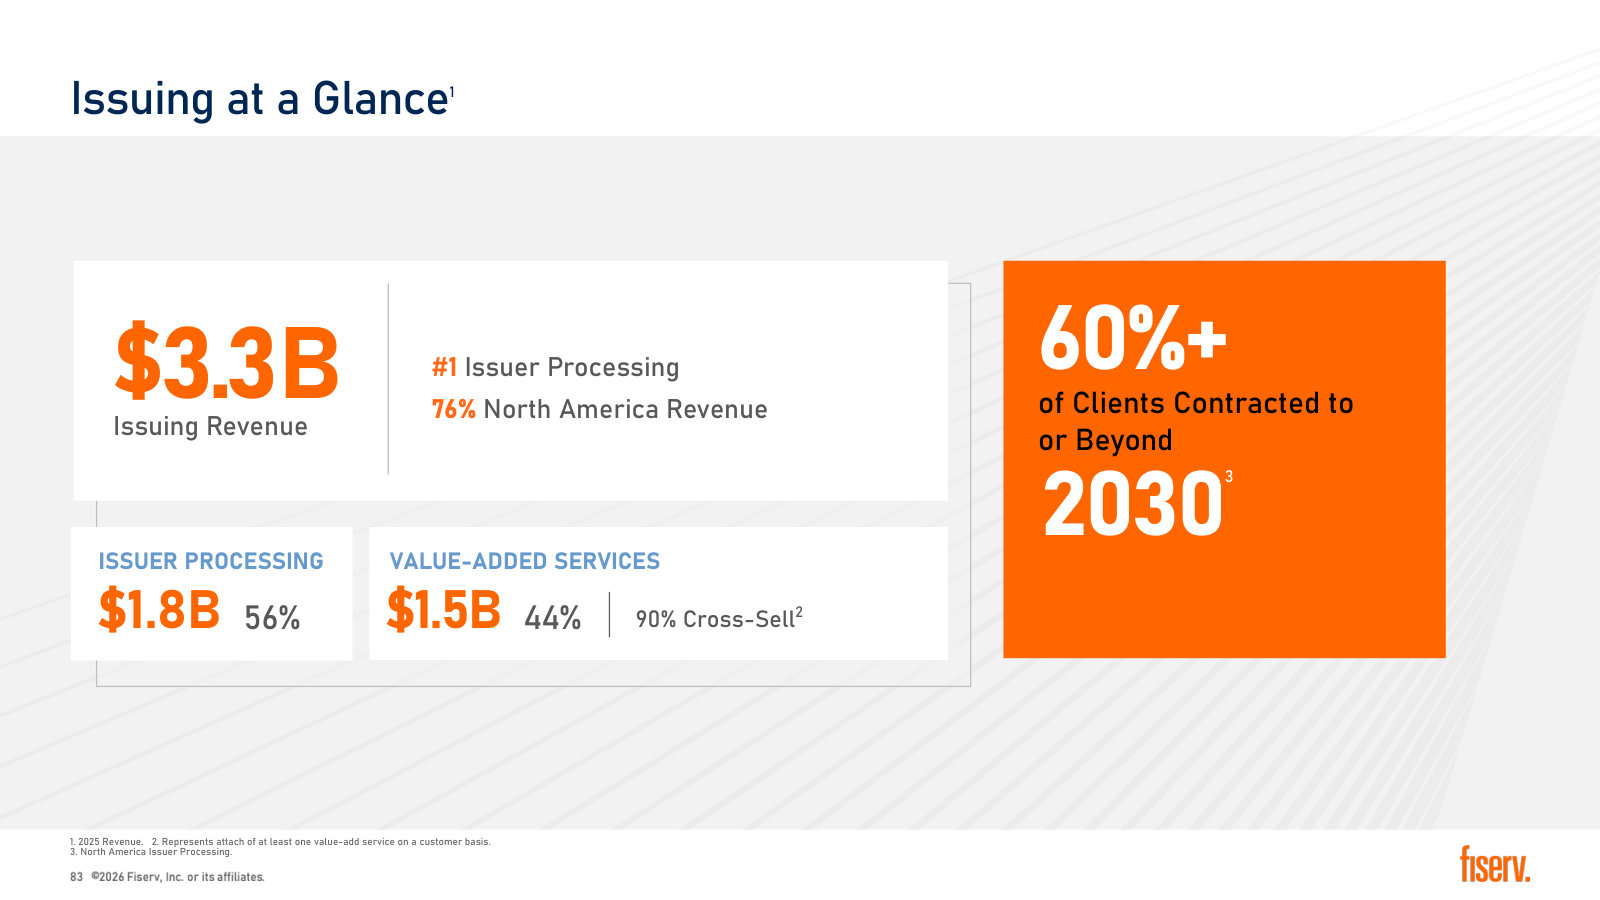
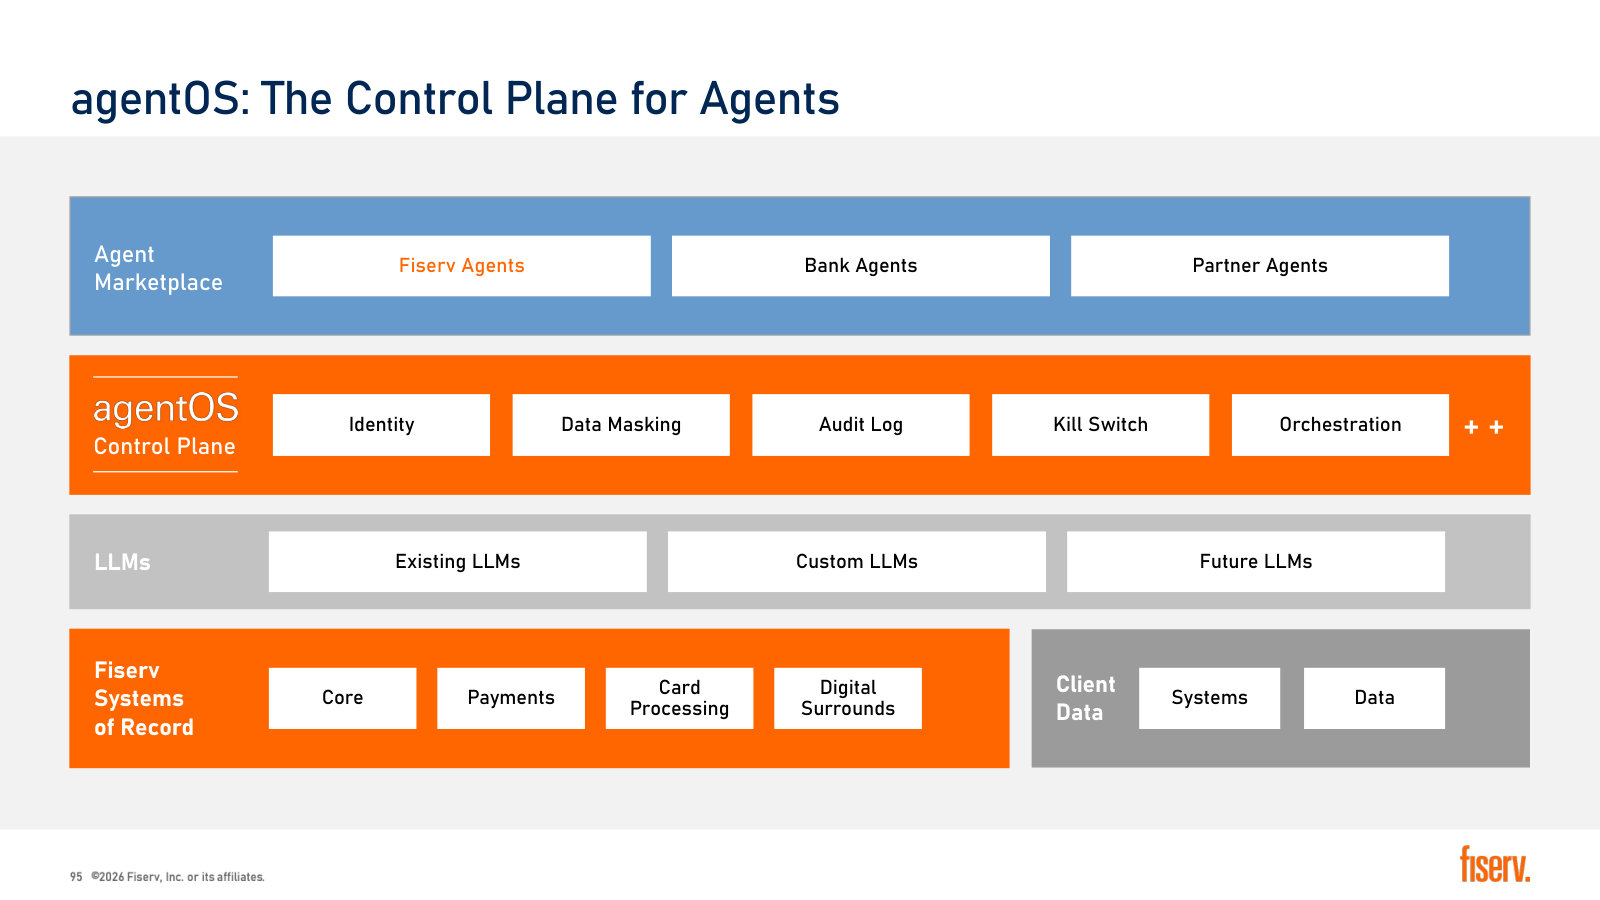
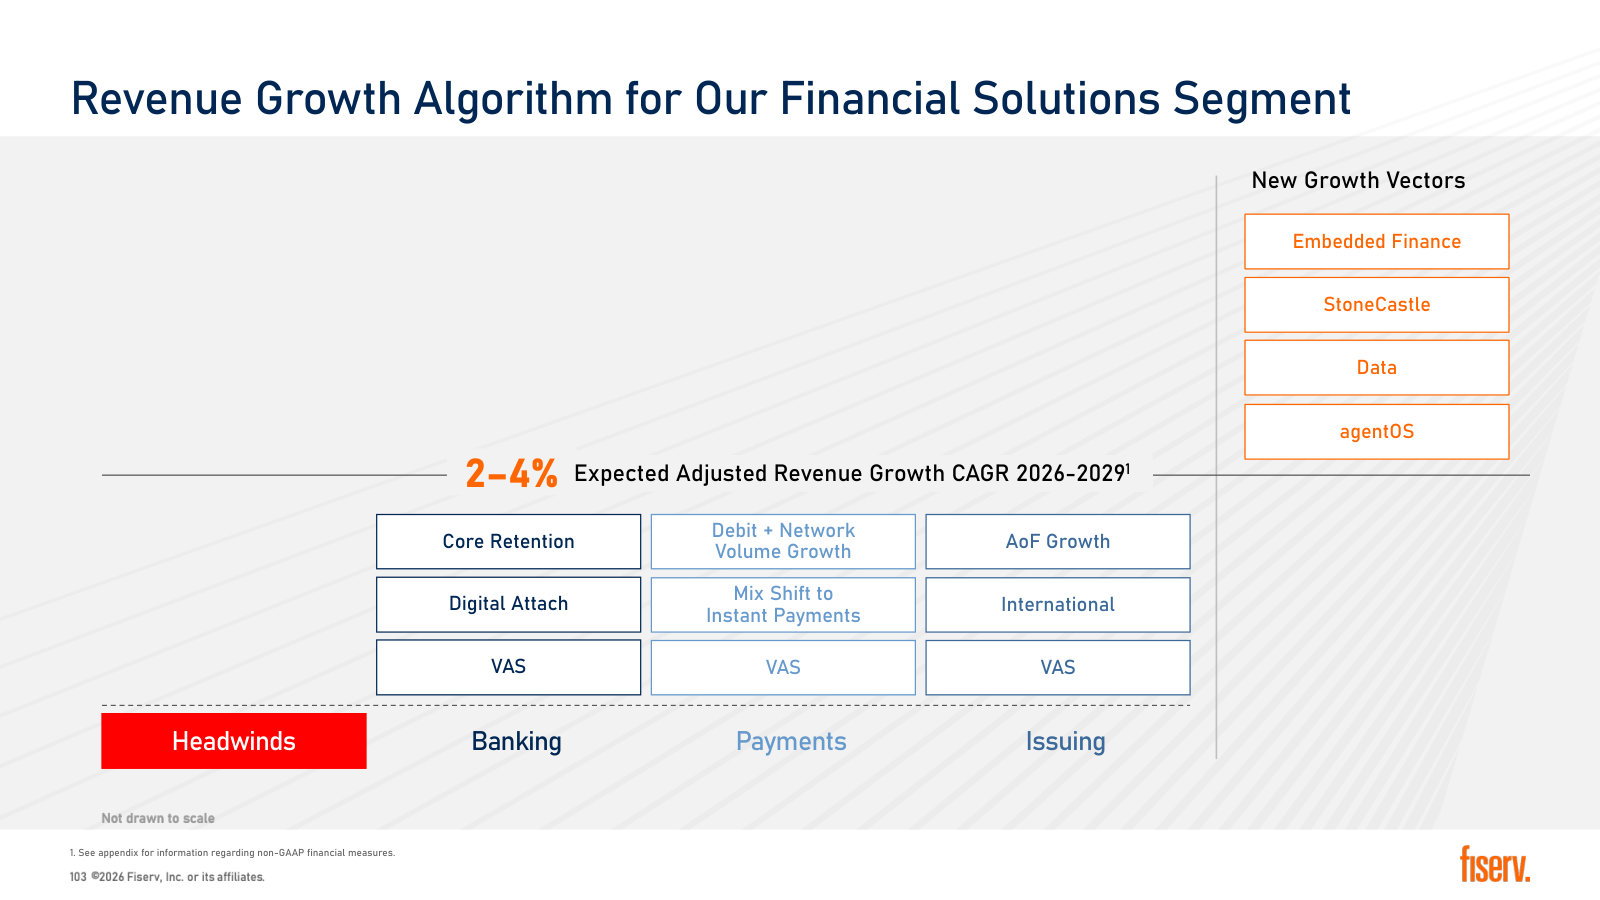
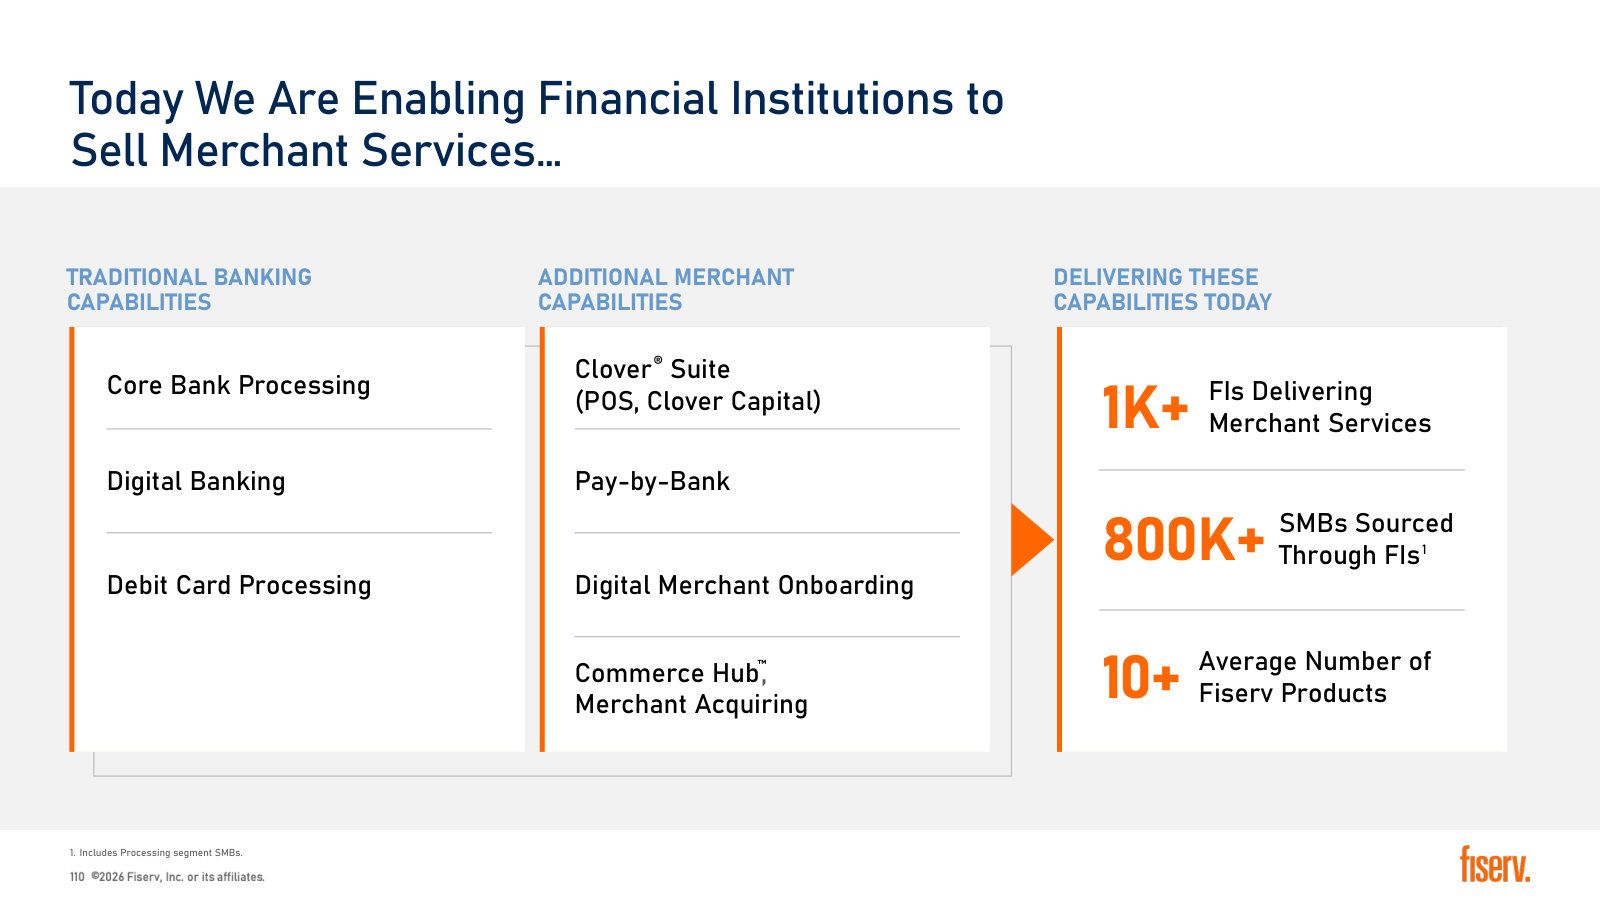
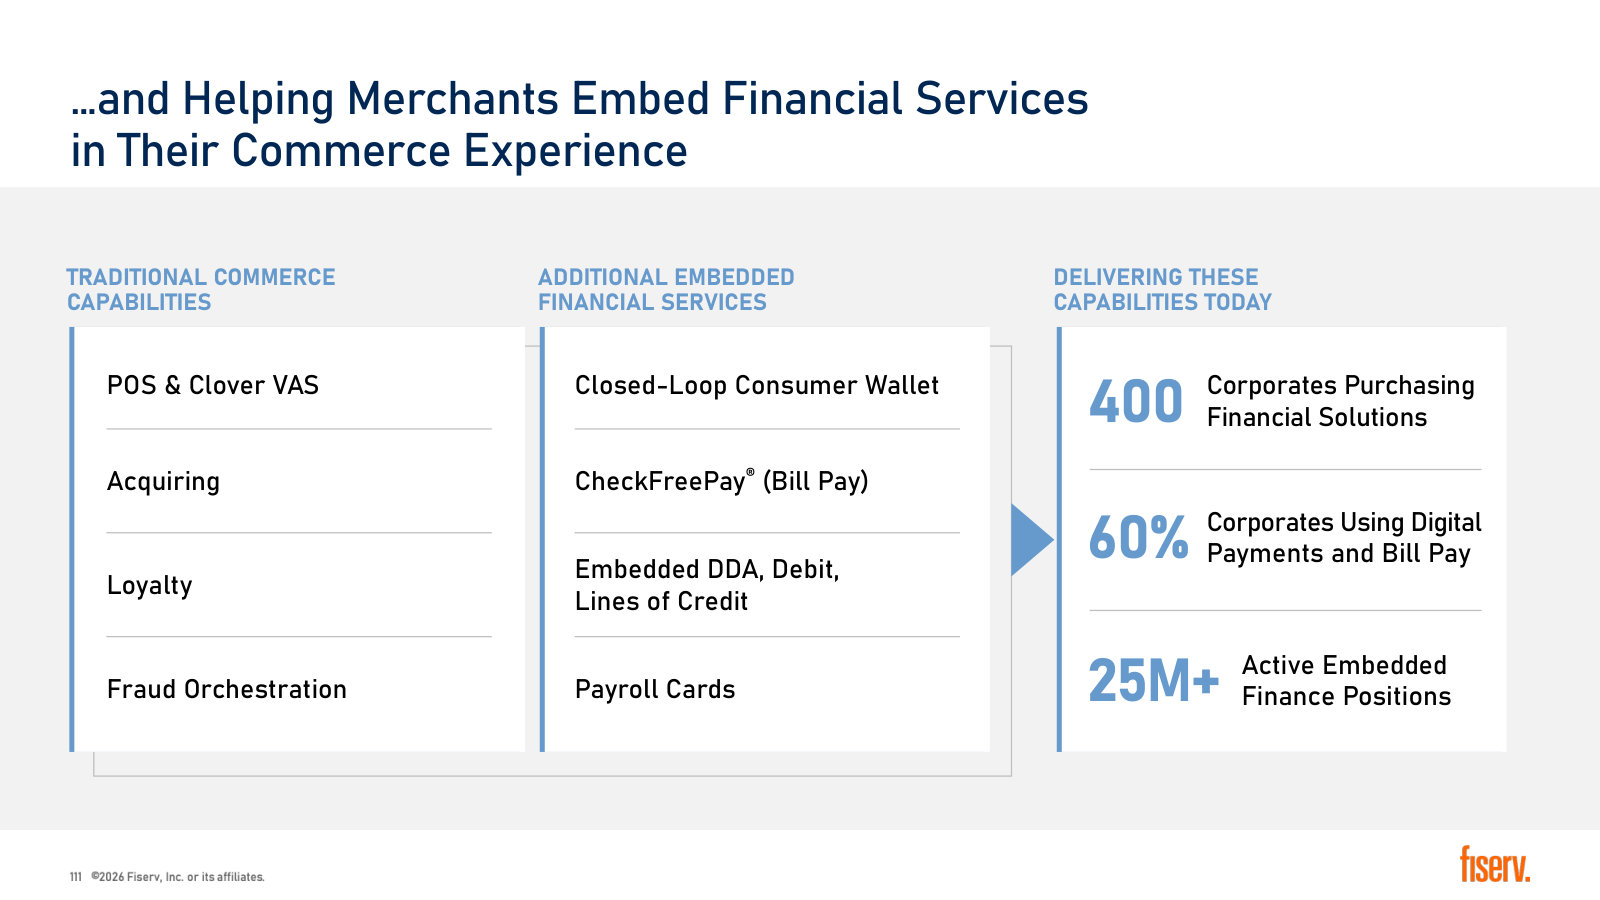
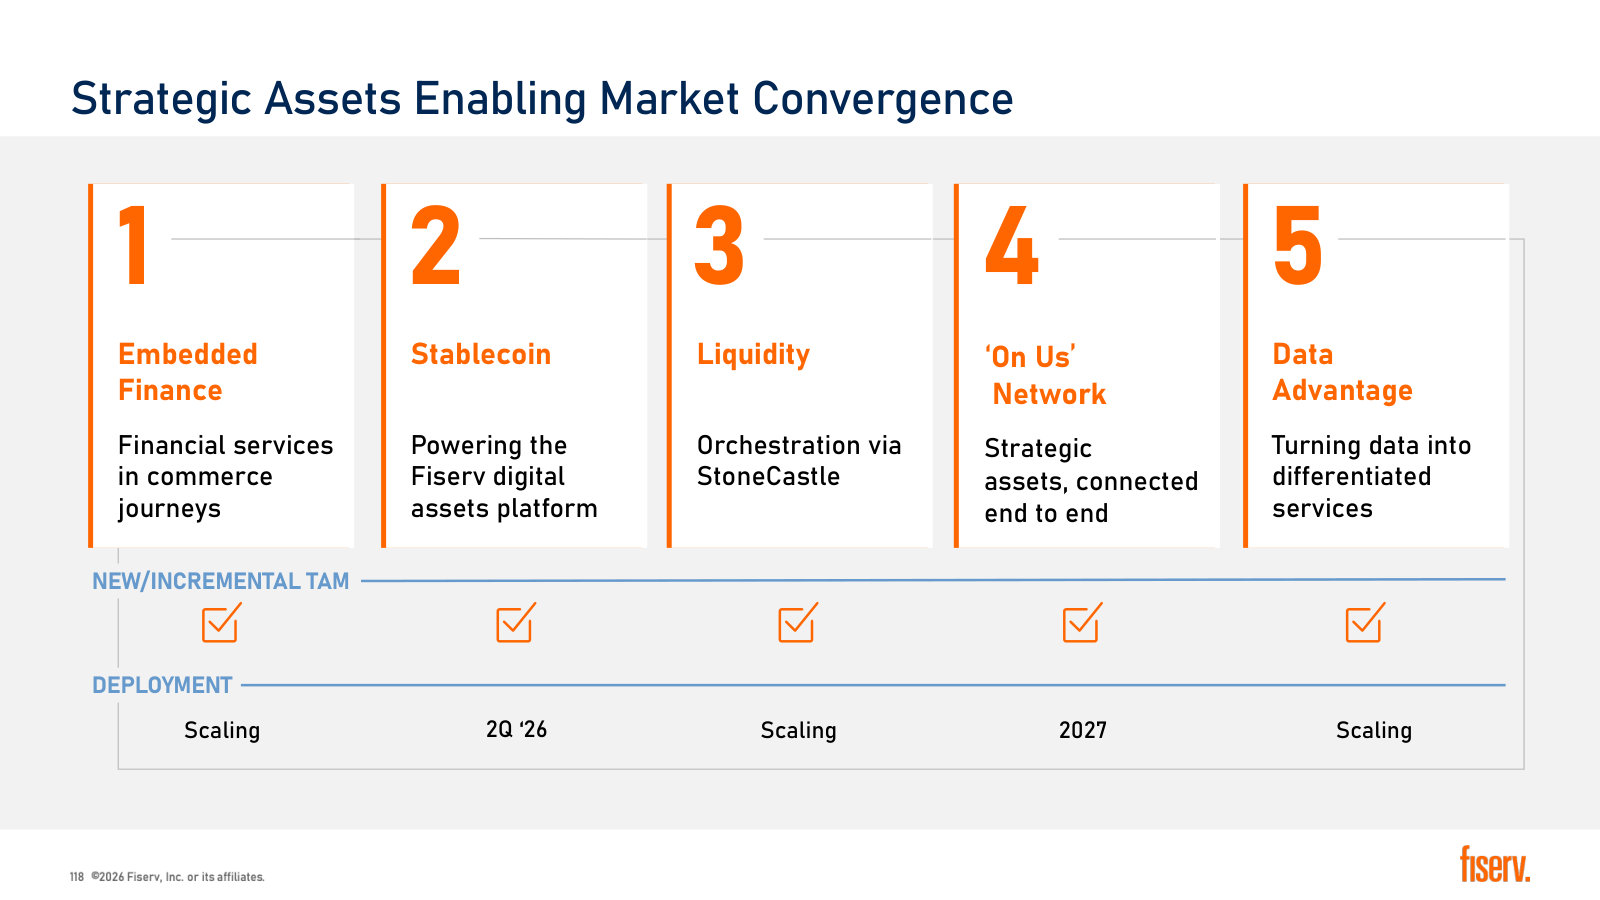
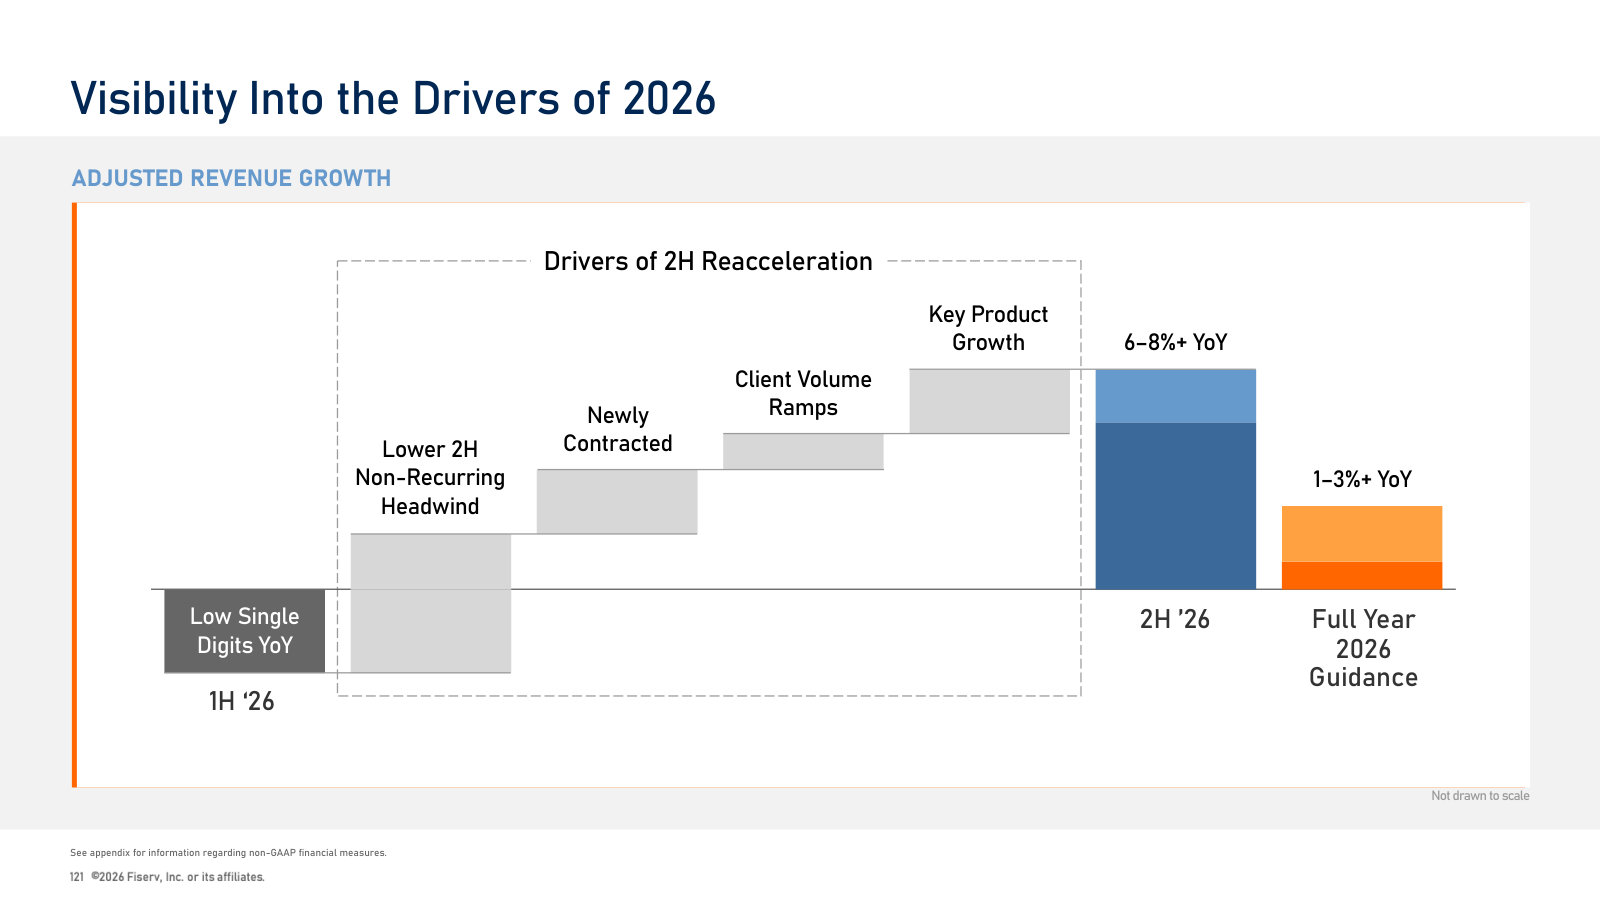
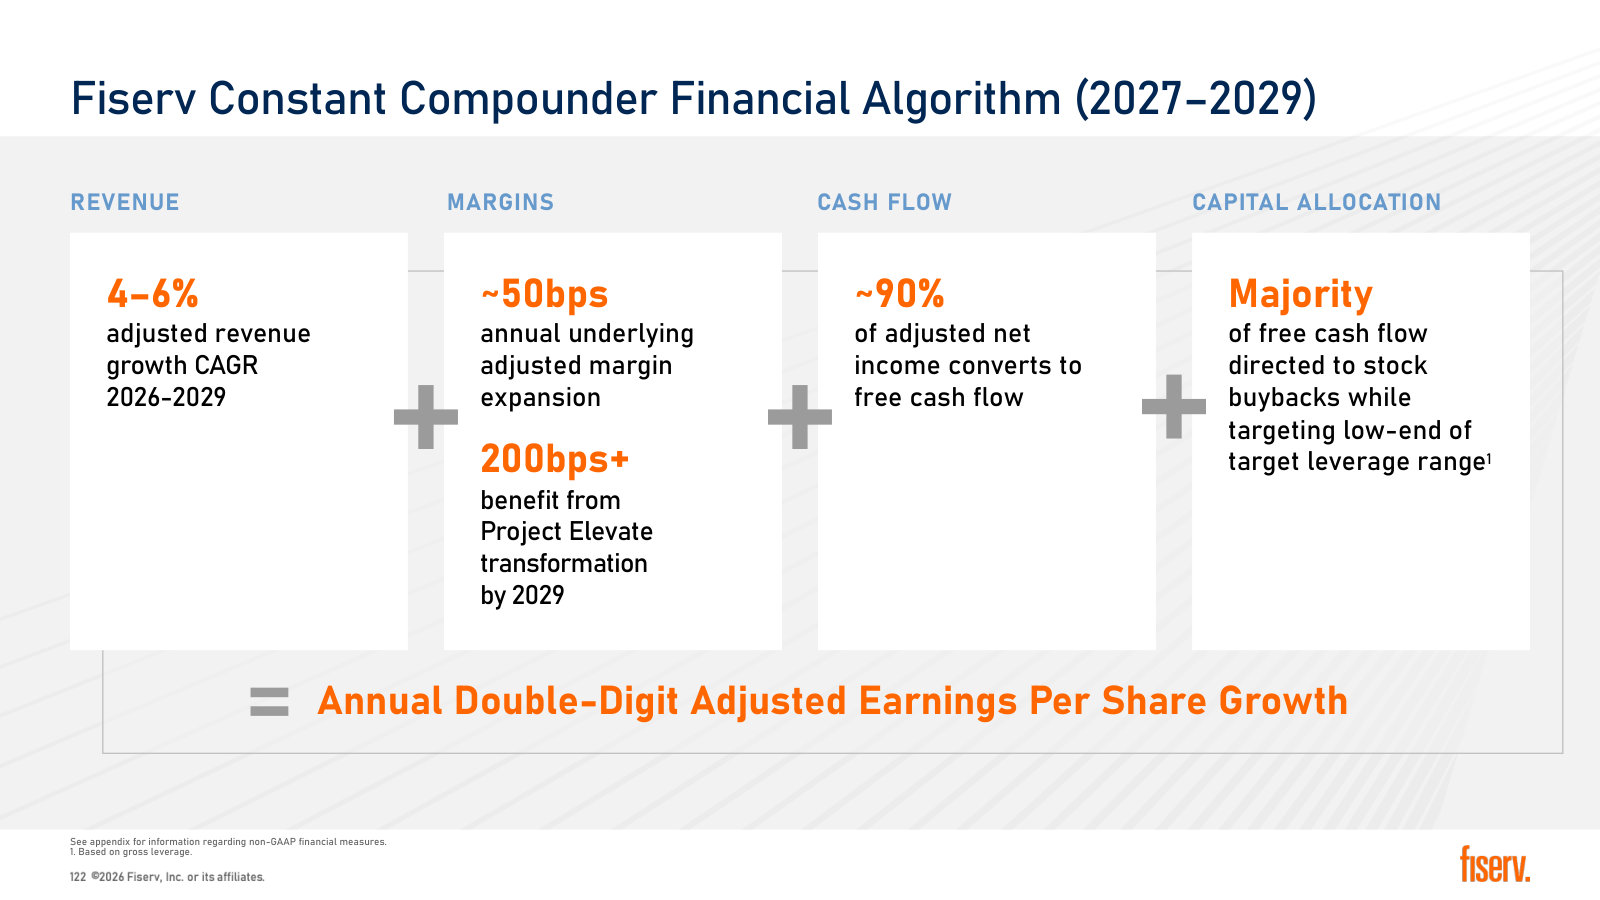
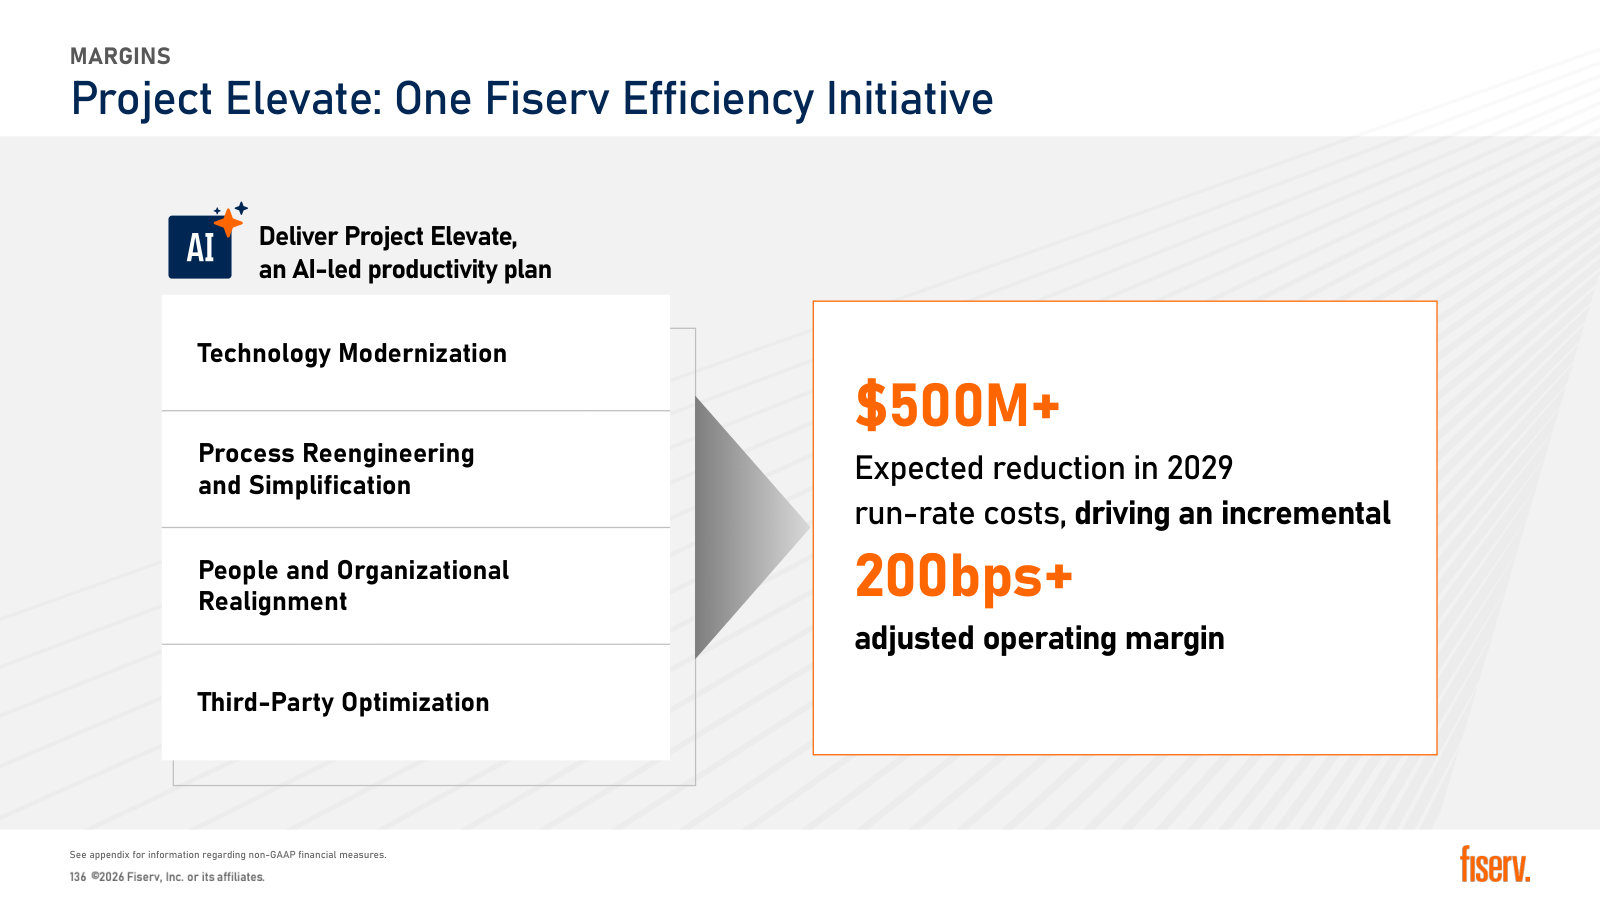
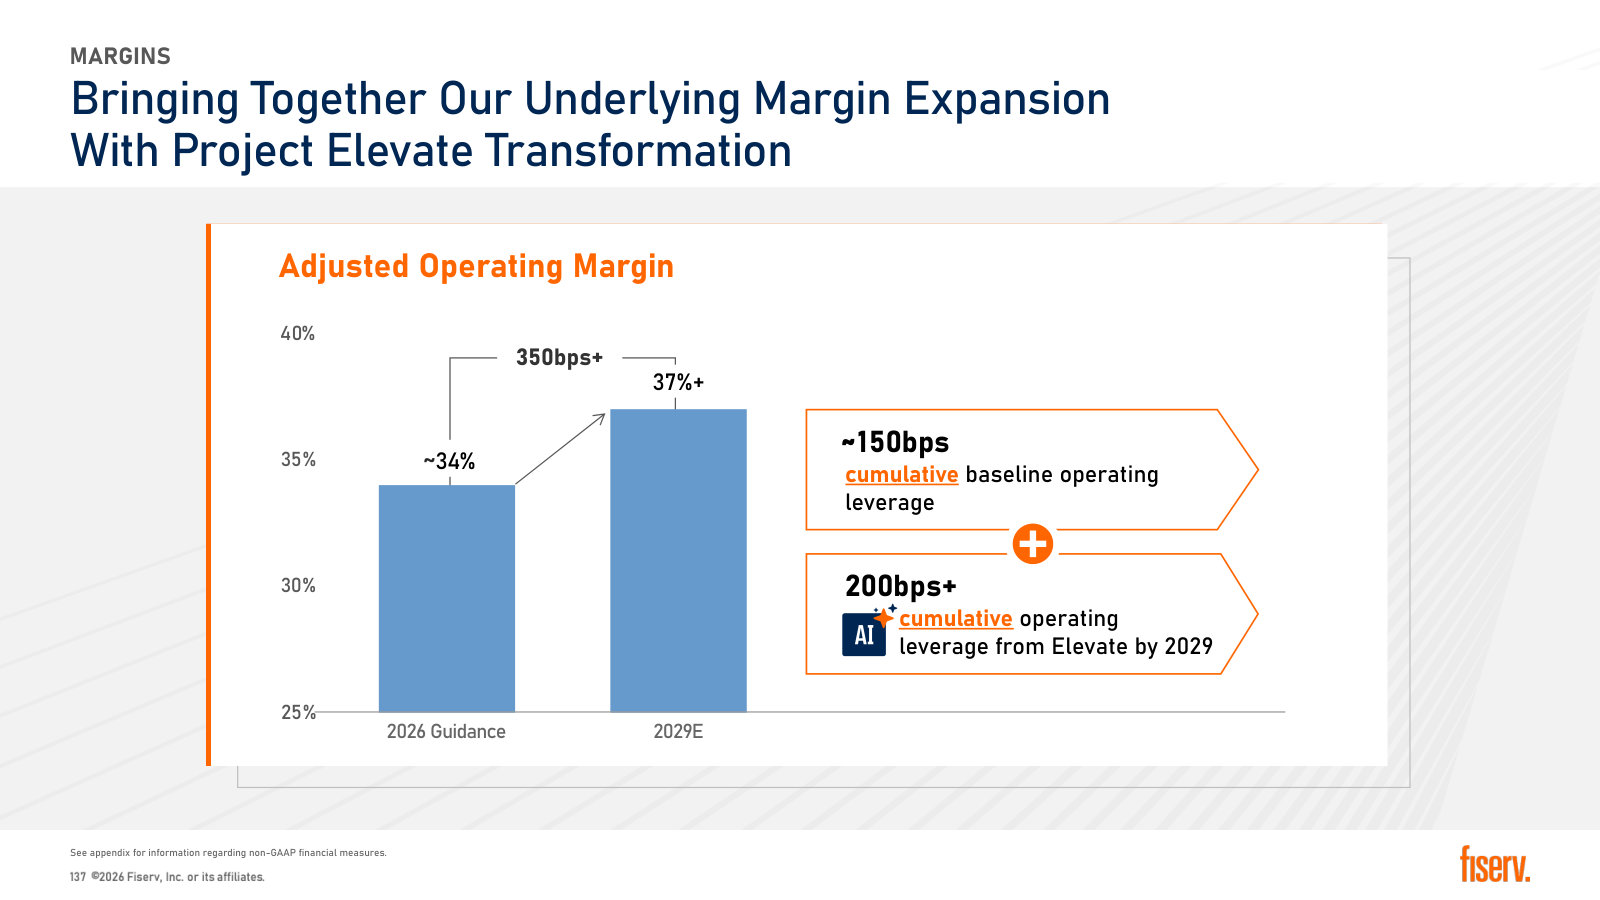
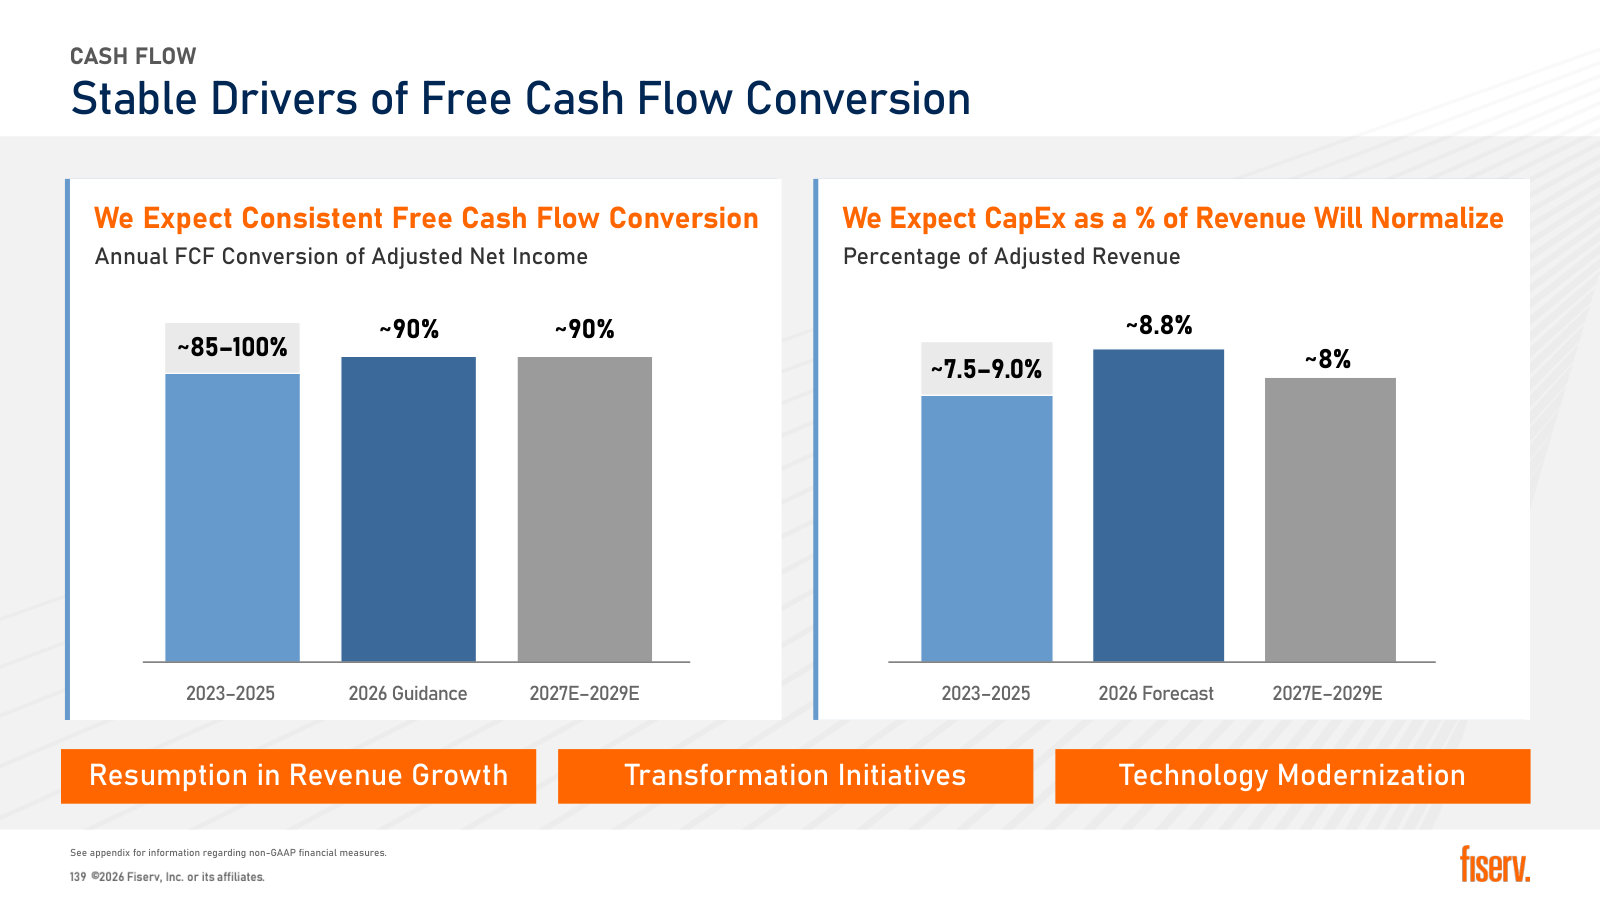
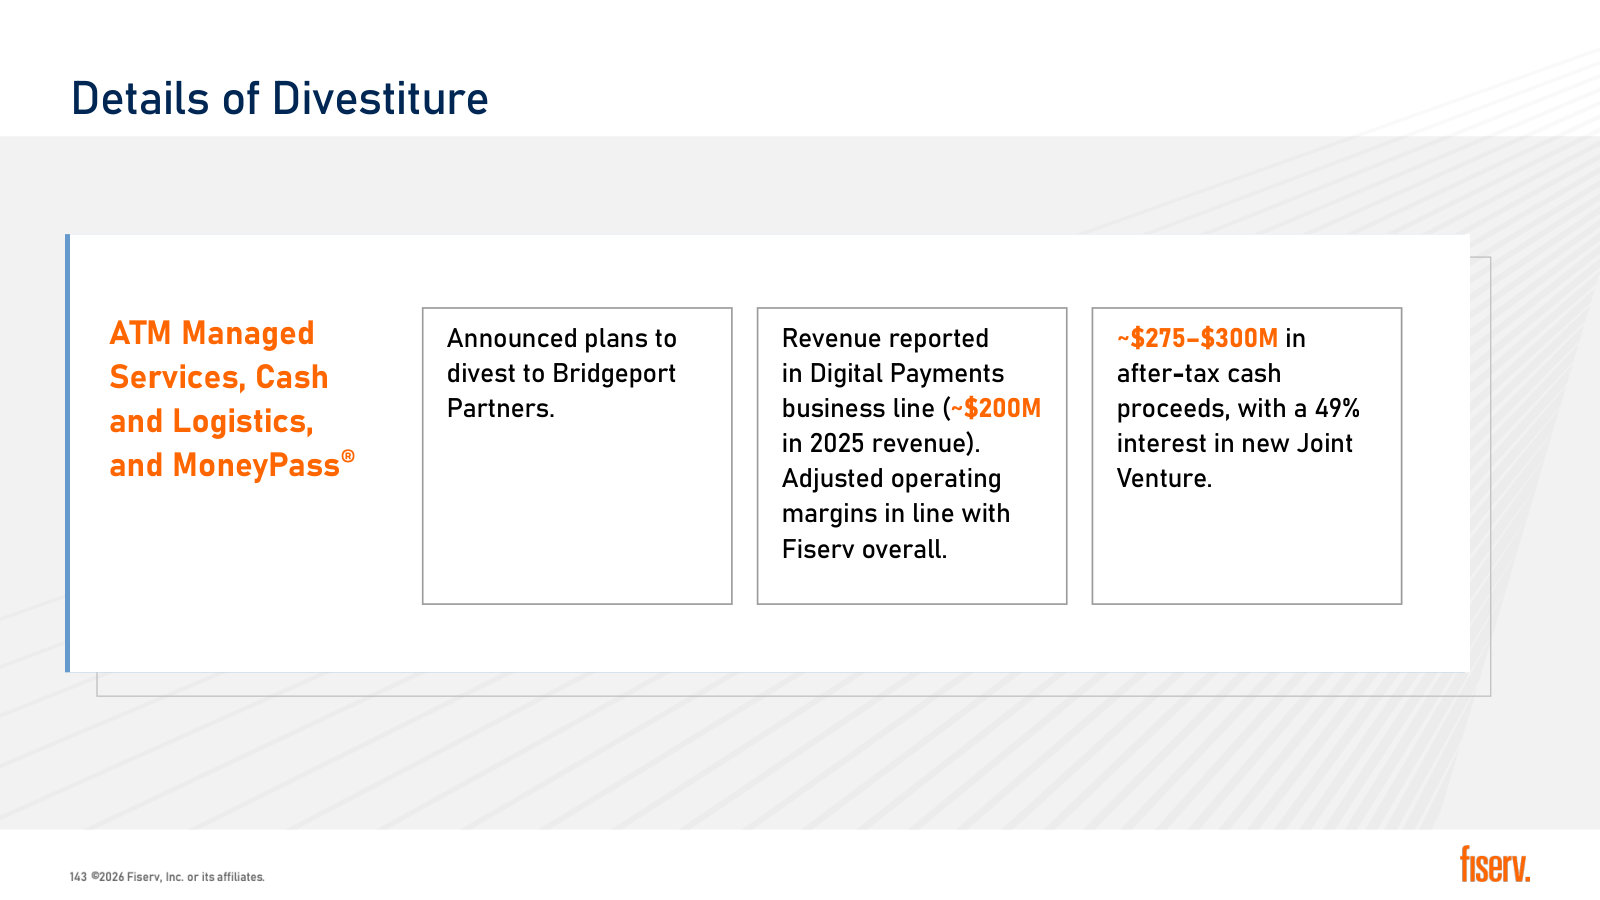
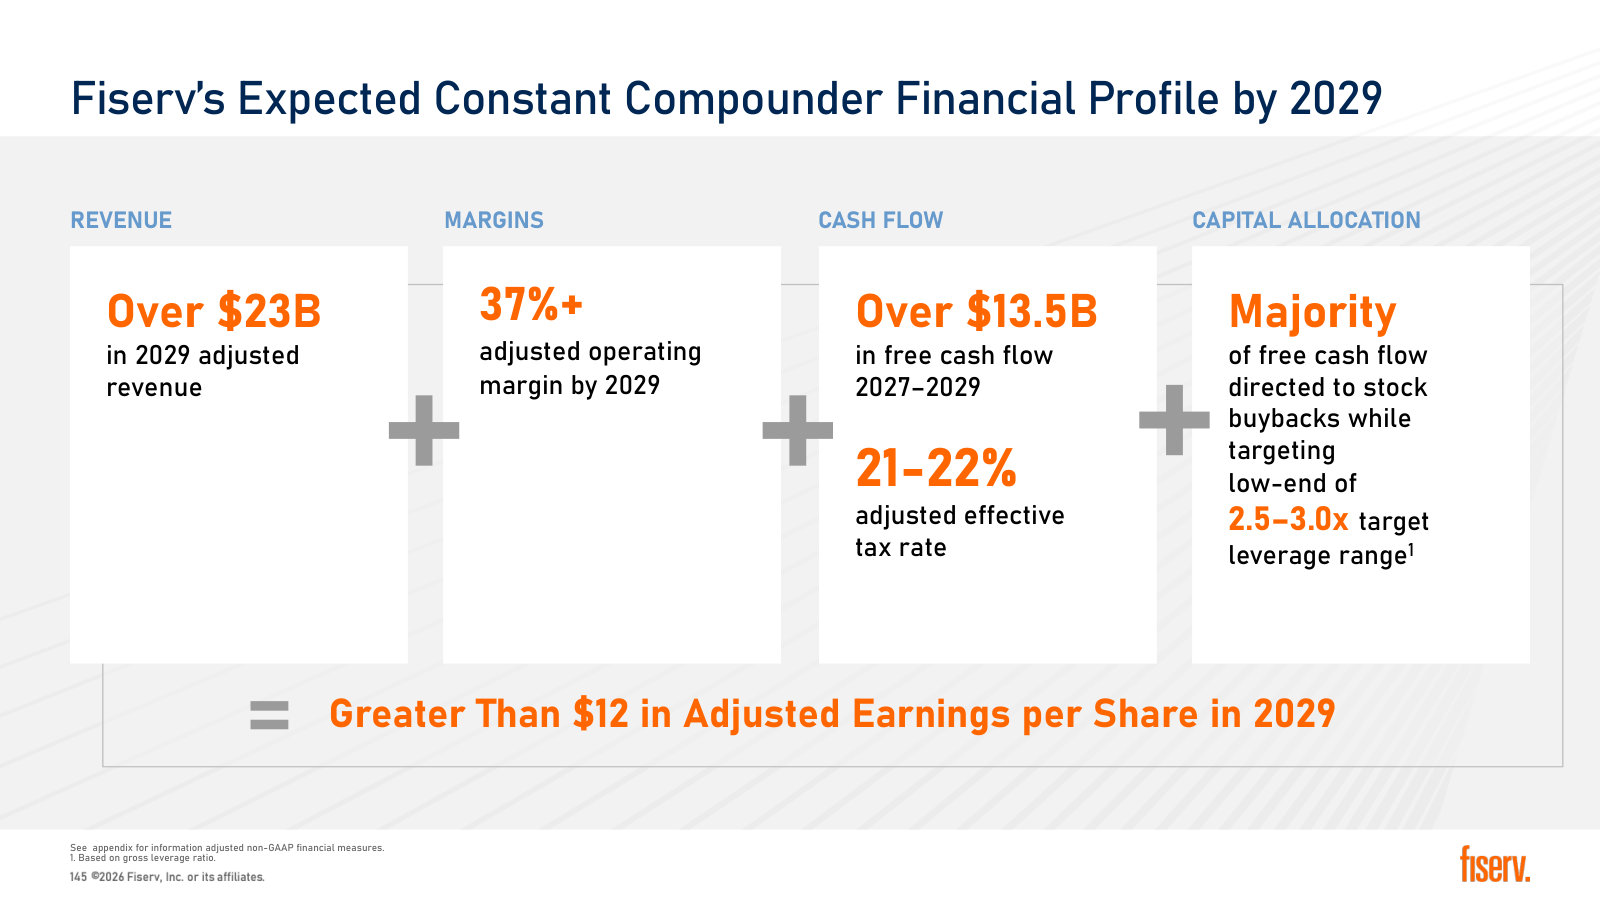
p. 8 — The company in one frame: two roughly $10B segments, a ~$290B and ~$140B TAM, and a strategy built on revenue per client. · Open the full presentation →p. 9 — Scale in numbers — $4.6T of merchant volume, 35% of U.S. payment volume, 1.8B issuer accounts, 6,000+ bank clients. · Open the full presentation →p. 12 — Underlying market growth rates by sub-market: 6-9% across the existing businesses, 10%+ in the emerging ones. · Open the full presentation →p. 13 — The headroom argument in donuts: 7% of U.S. SMB, 25% of U.S. banking, 35% of U.S. issuer processing, under 1% of emerging. · Open the full presentation →p. 15 — Capability matrix against six unnamed peers — Fiserv claims #1 in five of six existing markets and coverage no peer matches. · Open the full presentation →p. 17 — Cross-sell made concrete: named client types holding 1 to 44 Fiserv products across the five business lines. · Open the full presentation →p. 19 — The One Fiserv action plan — Operate, Build, Accelerate, Deliver, Allocate — the frame the rest of the day hangs on. · Open the full presentation →p. 20 — Core banking level-set: 16 cores, ~3,000 customers, $1.3B revenue, and an ABA survey where Fiserv ranks both first and last. · Open the full presentation →p. 21 — Core attrition ran ~1.5% of Financial Solutions revenue in 2023-25 against a ~75bps baseline; the plan is to get back there. · Open the full presentation →p. 30 — Merchant Solutions at scale: 3.9M SMBs, 910K Clover merchants, and 1K bank, 2K ISV and 3K ISO distribution partners. · Open the full presentation →p. 32 — The Commerce OS stack — Commerce Hub gateway, VAS layers, a single global switch and the Finxact ledger, carrying $200B of GPV. · Open the full presentation →p. 37 — Clover sized honestly: $3.3B of 2025 revenue against $6.8B of total SMB, and 0.9M of 2.7M merchants. · Open the full presentation →p. 40 — Clover share by SMB vertical — 10%+ in retail and restaurants, roughly 5% in healthcare and professional services. · Open the full presentation →p. 43 — Channel economics: direct and bank channels are ~40% of new outlets but ~80% of revenue; ISO/agent is the reverse. · Open the full presentation →p. 46 — International Clover: 36%+ outlet CAGR, live in 12 countries through bank partners, Japan launching in 2027. · Open the full presentation →p. 47 — The $4B non-Clover SMB base and what conversion is worth — roughly 15% more revenue per client on VAS, 30% on full Clover. · Open the full presentation →p. 48 — Clover's medium-term bridge: 10-15% GPV growth building to 15-20% revenue growth, with each contributing piece named. · Open the full presentation →p. 51 — Where the enterprise business is not: Fiserv skews card-present while the fast-growing, higher-take-rate pools sit elsewhere. · Open the full presentation →p. 54 — The enterprise value-added services menu with measured client benefits, and the claim of 2-4x take rates over plain processing. · Open the full presentation →p. 58 — How the 6-8% Merchant CAGR is built: Clover at 15-20%, enterprise mid-single, and half the segment roughly flat. · Open the full presentation →p. 64 — Financial Solutions by client type and revenue: 6,000+ clients, Banking $2.4B, Digital Payments $3.9B, Issuing $3.3B. · Open the full presentation →p. 67 — Banking at a glance — $2.4B across 3,500+ institutions, split core $1.3B, digital $0.5B, value-added services $0.6B. · Open the full presentation →p. 68 — U.S. bank count has halved since 2005 while Fiserv banking revenue kept rising; deposit and loan accounts are still growing. · Open the full presentation →p. 76 — Digital Payments at a glance: $3.9B, 41 of the top 50 U.S. banks, entirely North American. · Open the full presentation →p. 77 — The mix shift inside payments — bill pay transactions falling 8-11% a year while account-to-account grows 17-33%. · Open the full presentation →p. 83 — Issuing at a glance: $3.3B, VAS already 44% of revenue, and 60%+ of clients contracted to or beyond 2030. · Open the full presentation →p. 95 — agentOS architecture — the control plane Fiserv wants to sit between banks' agents, the LLMs and its own systems of record. · Open the full presentation →p. 103 — The Financial Solutions growth algorithm: 2-4% CAGR from retention, digital attach and VAS, plus four new growth vectors. · Open the full presentation →p. 110 — Banks as a merchant channel: 1,000+ institutions selling merchant services, 800K+ SMBs sourced that way. · Open the full presentation →p. 111 — The same trade in reverse — merchants embedding banking products, with 25M+ active embedded finance positions today. · Open the full presentation →p. 118 — The five convergence assets — embedded finance, stablecoin, liquidity, the 'On Us' network, data — with deployment timing. · Open the full presentation →p. 121 — The 2026 shape: low single digits in 1H, a bridge to 6-8%+ in 2H, and 1-3% for the full year. · Open the full presentation →p. 122 — The 'constant compounder' algorithm: 4-6% revenue, ~50bps annual margin plus 200bps+ from Elevate, ~90% cash conversion. · Open the full presentation →p. 136 — Project Elevate: an AI-led cost programme targeting $500M+ of run-rate reduction and 200bps+ of margin by 2029. · Open the full presentation →p. 137 — The margin bridge from ~34% in 2026 to 37%+ in 2029, split between baseline operating leverage and Elevate. · Open the full presentation →p. 139 — Cash conversion held at ~90% while capex normalises from ~8.8% of revenue back toward ~8%. · Open the full presentation →p. 143 — The announced divestiture — ATM services, cash logistics and MoneyPass, ~$200M of 2025 revenue, $275-300M of proceeds. · Open the full presentation →p. 145 — The 2029 scorecard management will be measured against: $23B+ revenue, 37%+ margin, $13.5B+ cash flow, $12+ adjusted EPS. · Open the full presentation →
The most recent quarterly scorecard, nine days before the Investor Day — current segment revenue, margins and the standing 2026 guidance. · Open the full document →
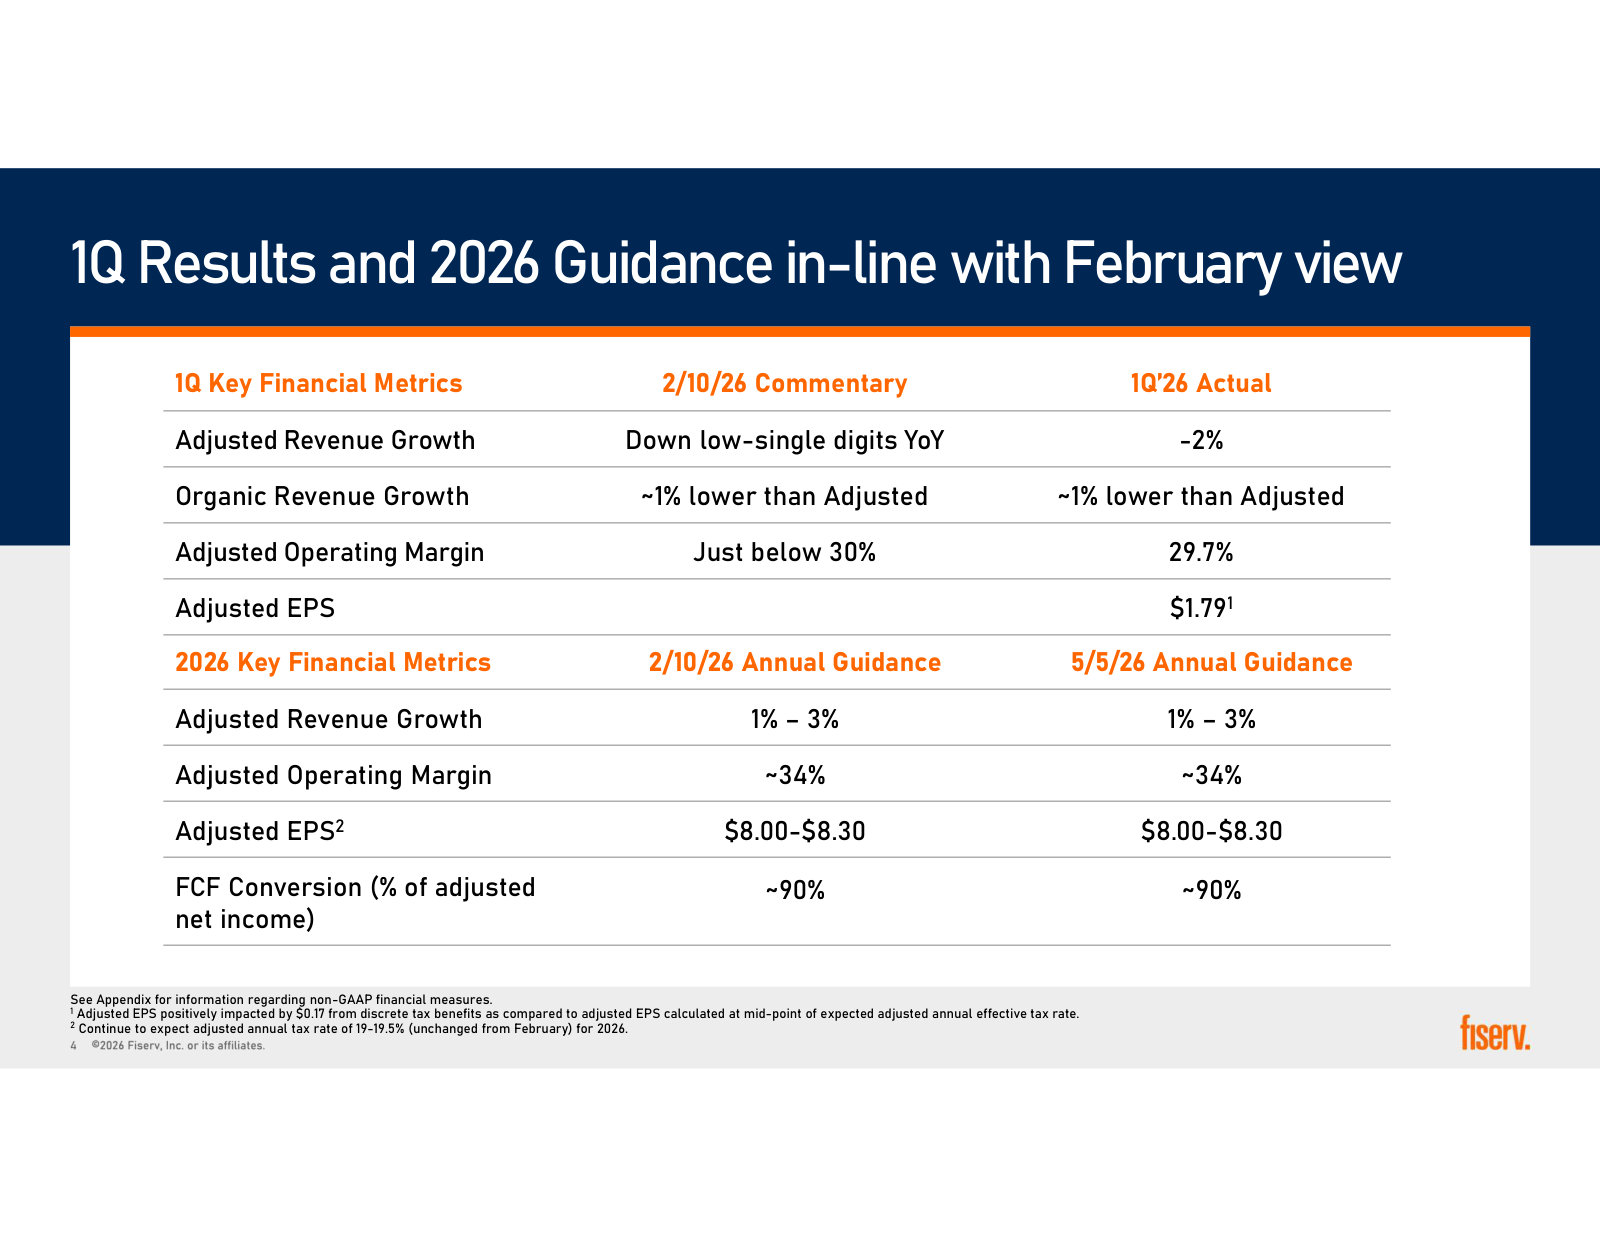
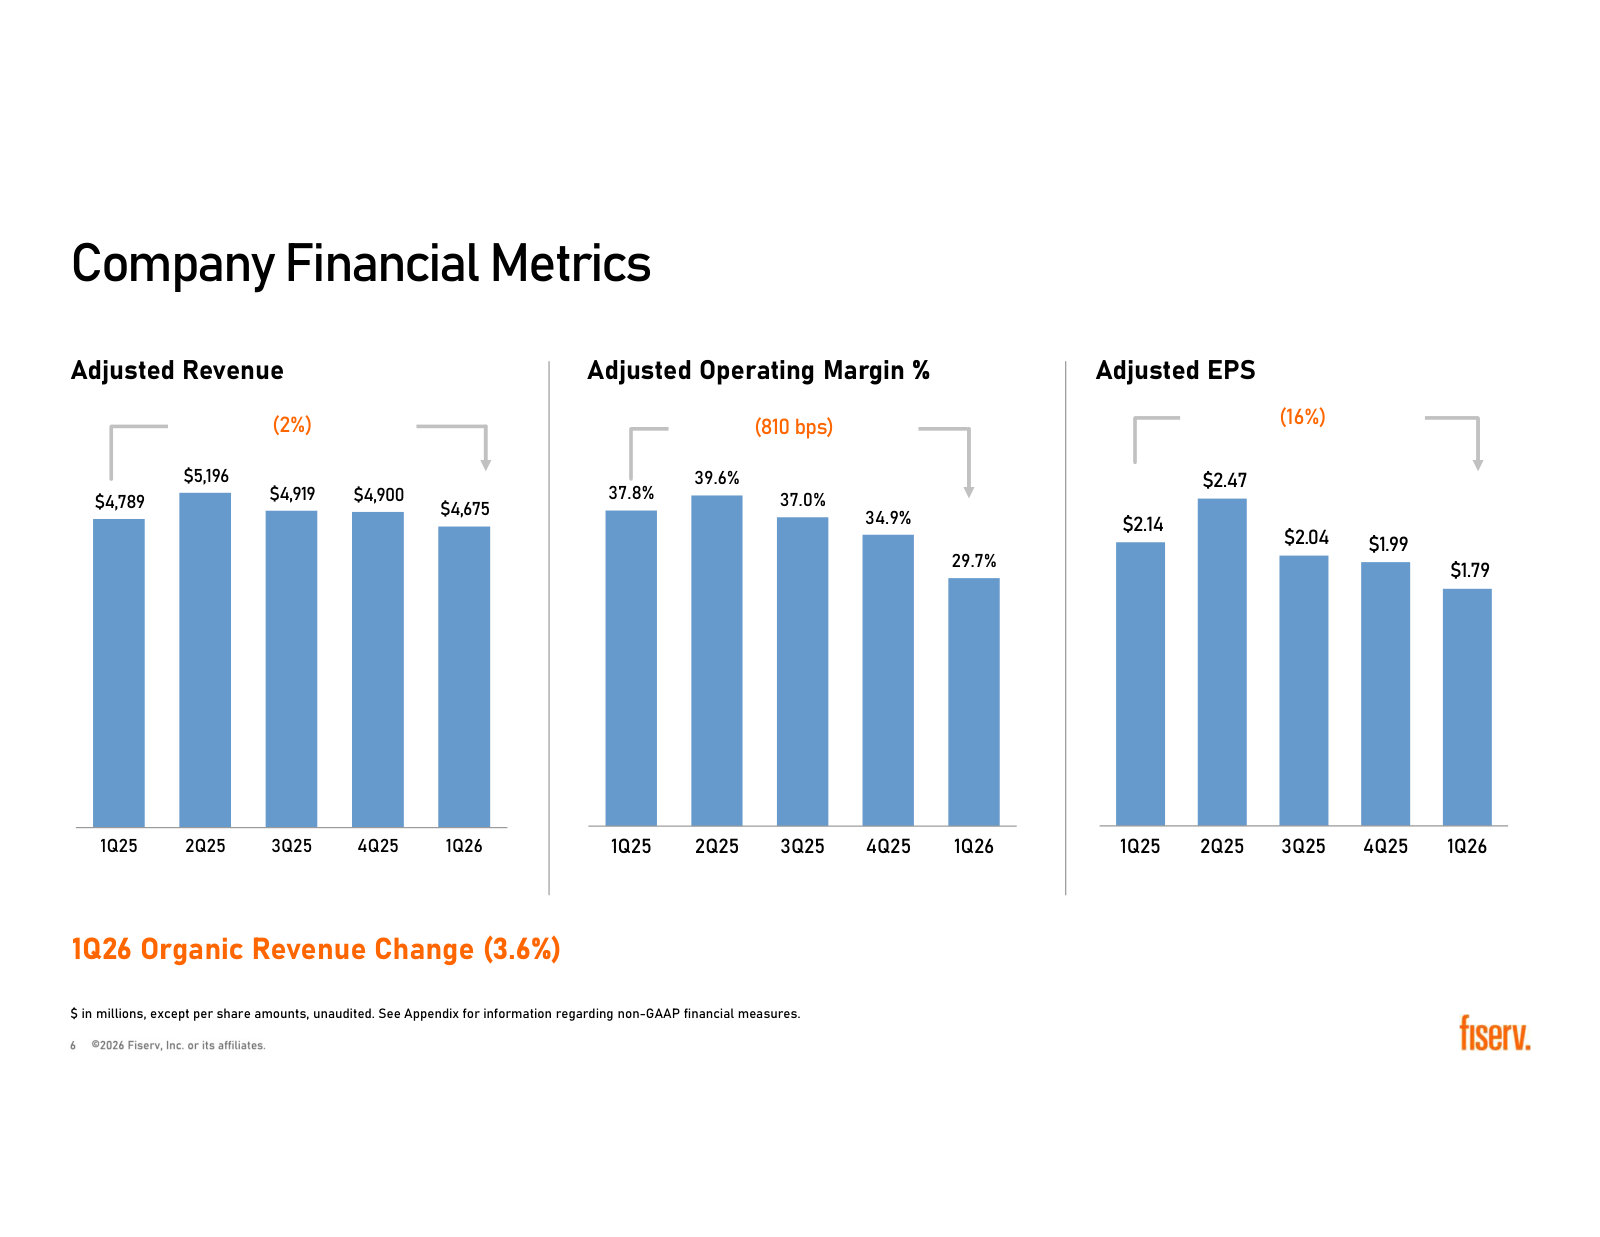
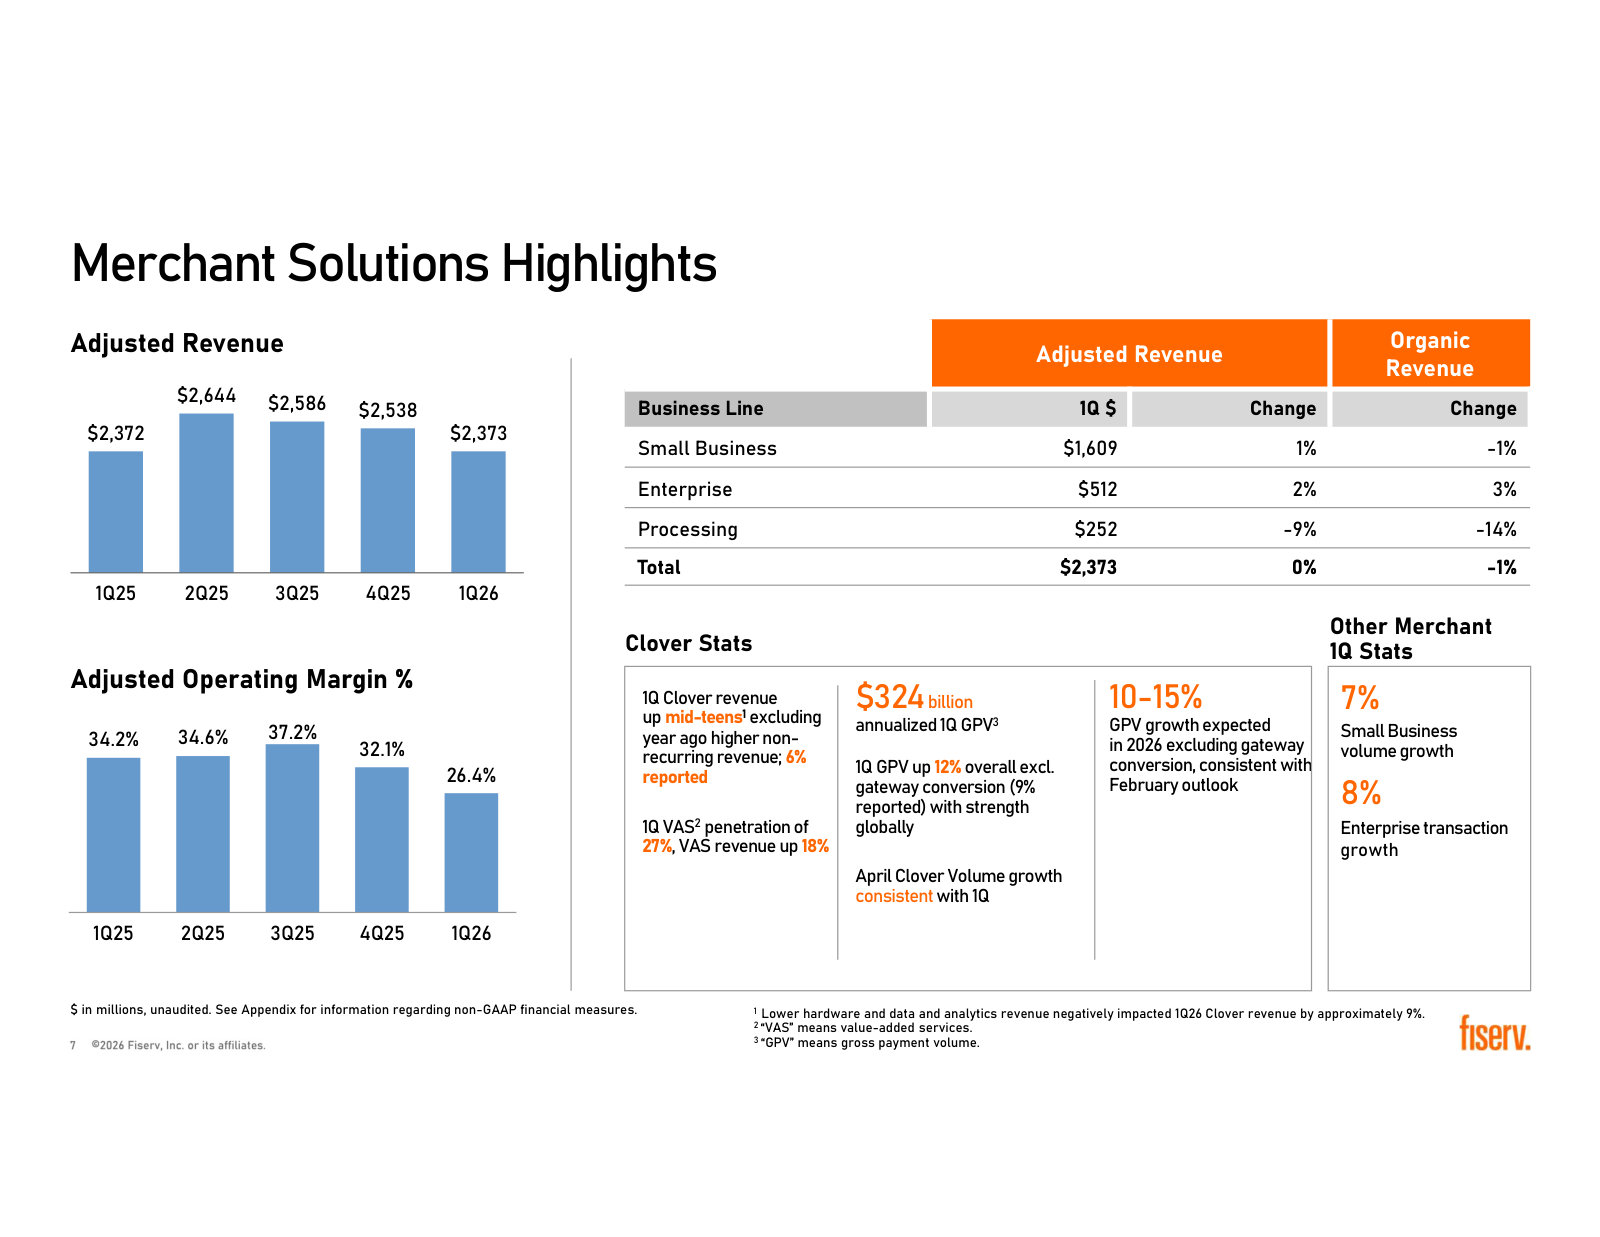
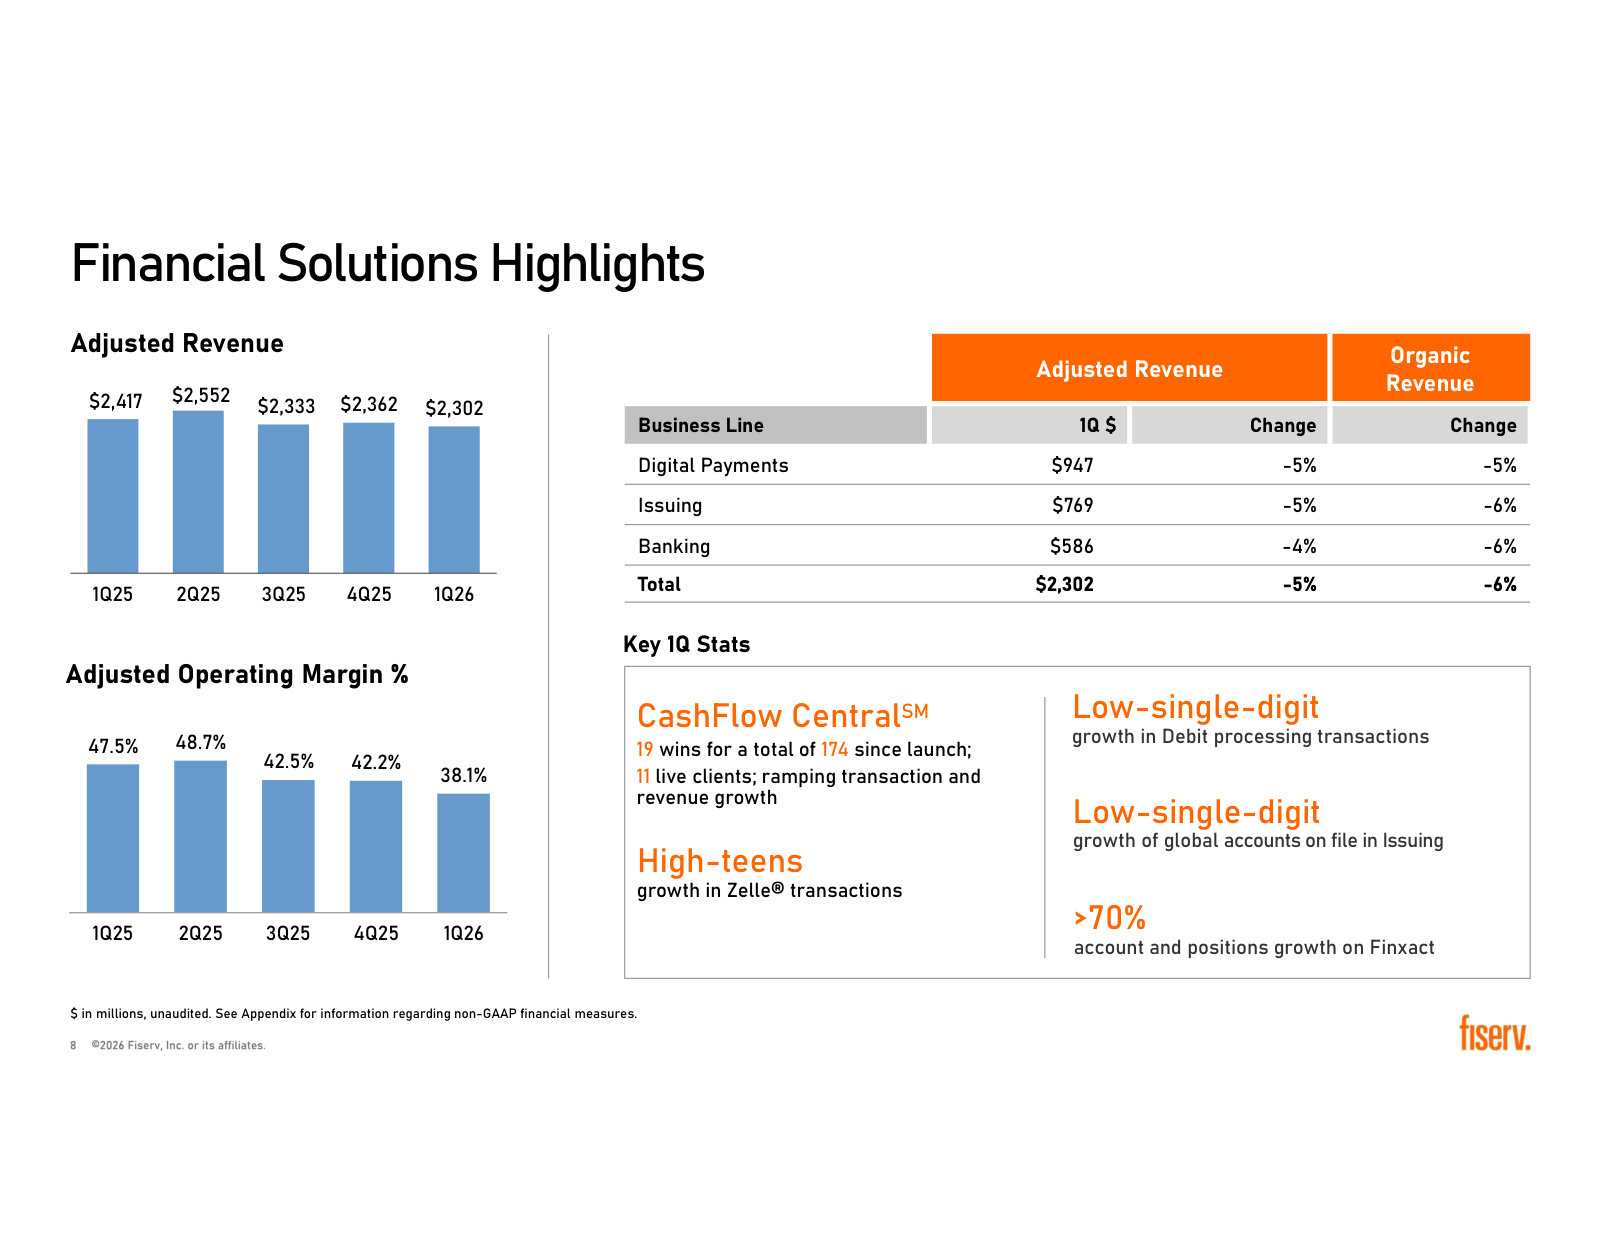
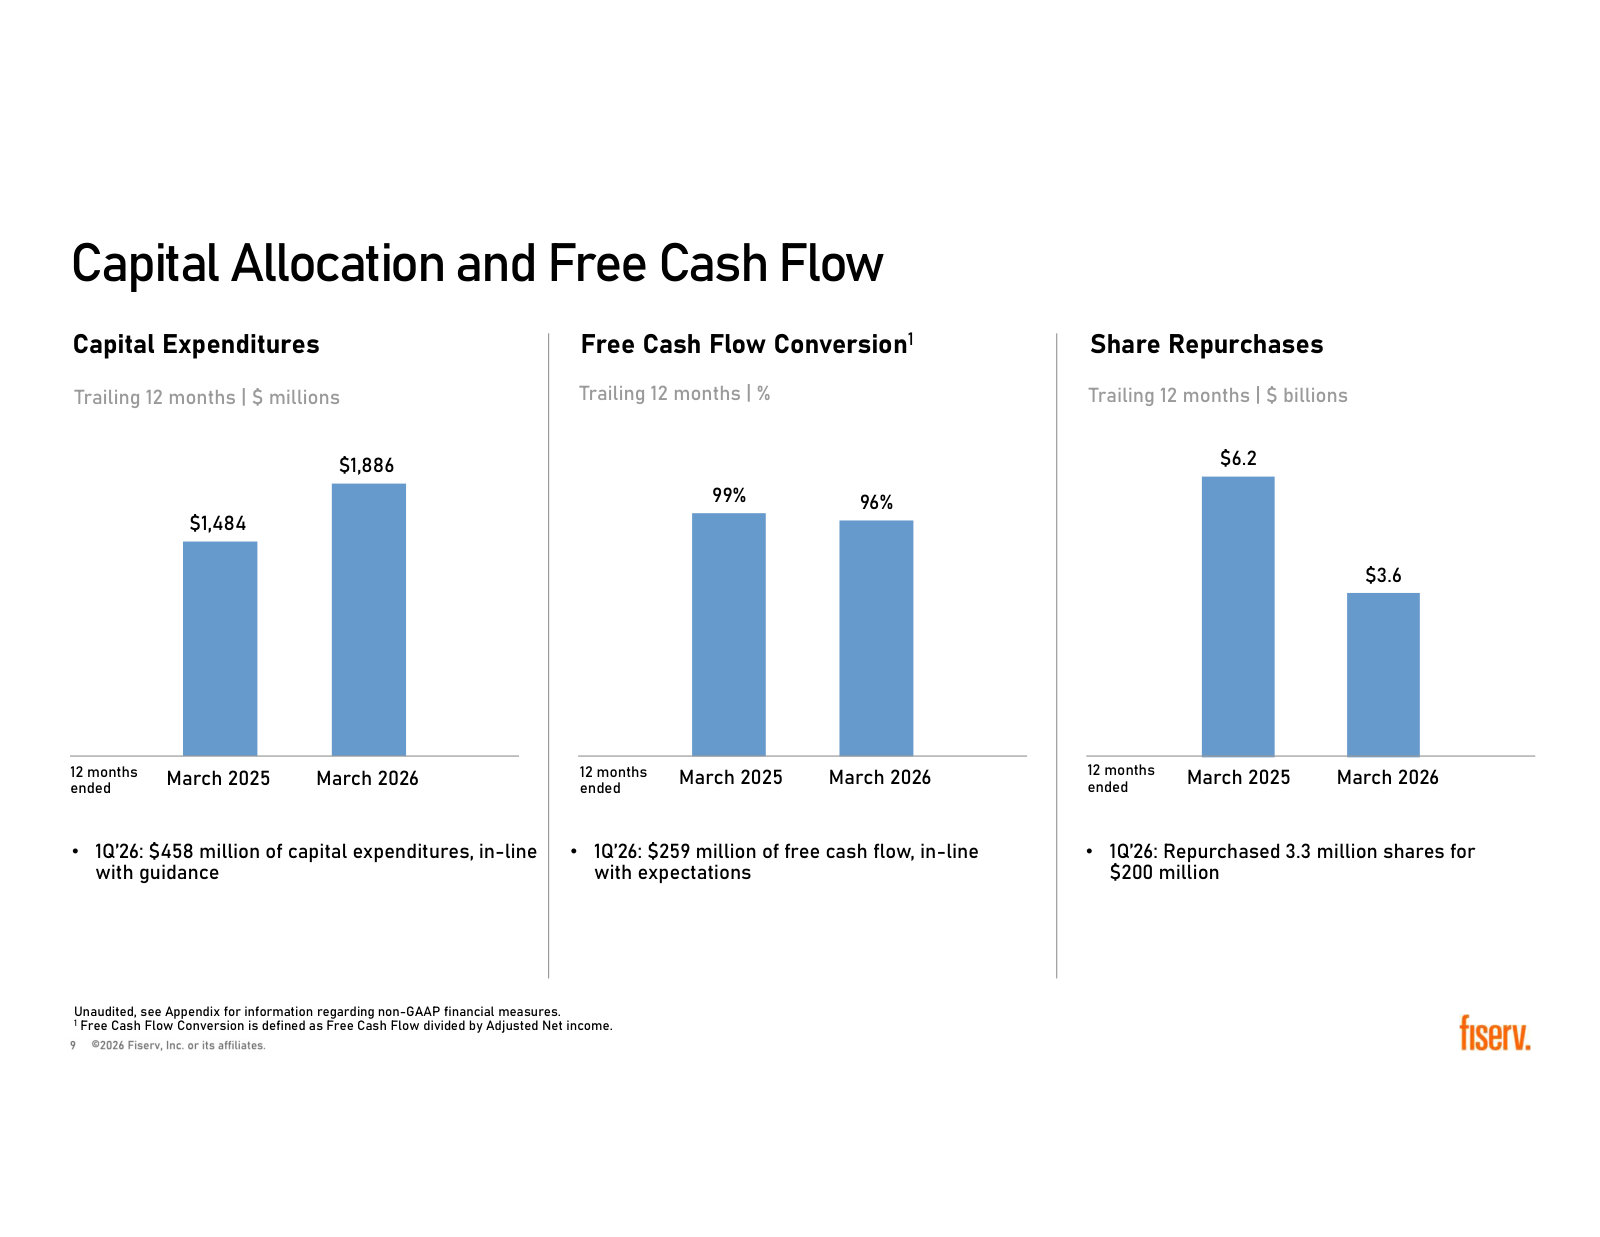
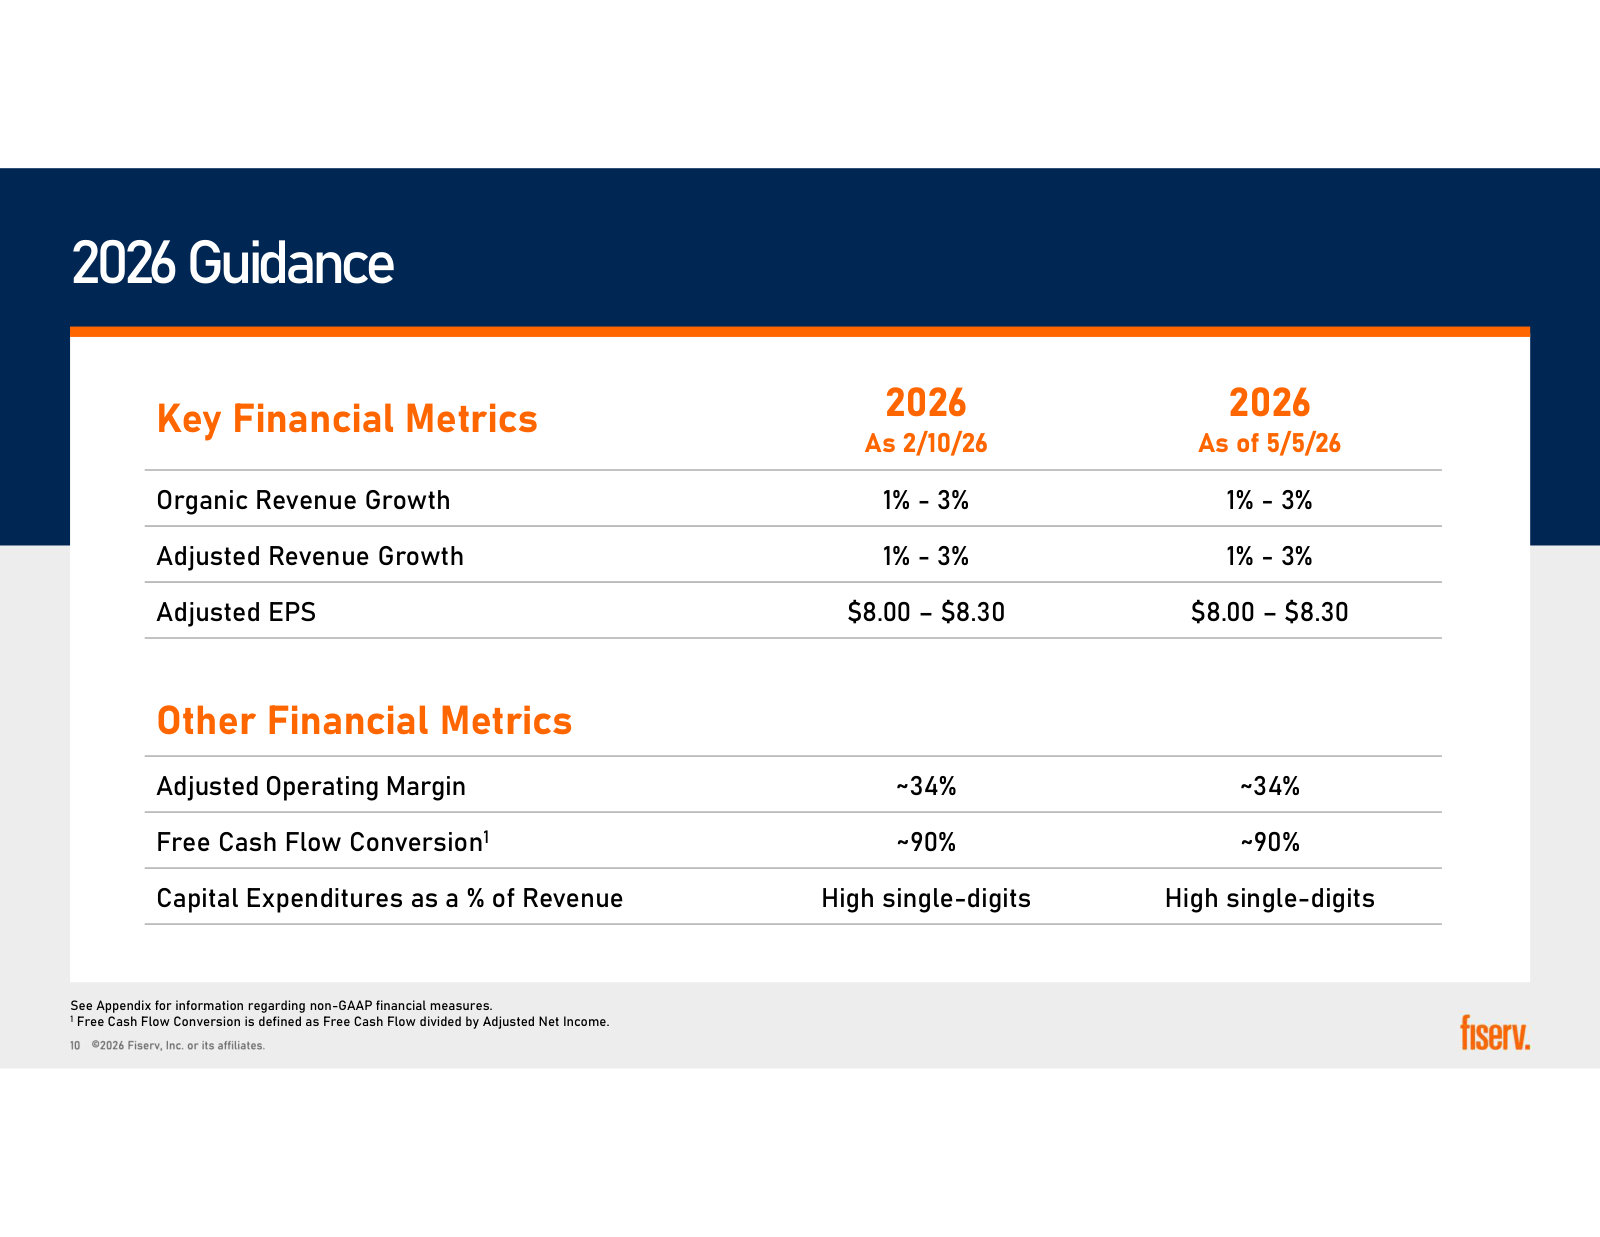
p. 4 — Guidance versus delivery: what management said in February against what 1Q actually printed, and the unchanged full-year numbers. · Open the full presentation →p. 6 — Five quarters of company revenue, adjusted operating margin and EPS — margin down 810bps year on year to 29.7%. · Open the full presentation →p. 7 — Merchant Solutions by business line, with Clover stats: $324B annualised GPV and 12% growth excluding the gateway conversion. · Open the full presentation →p. 8 — Financial Solutions by business line — Digital Payments, Issuing and Banking all down 4-6%, with margin at 38.1%. · Open the full presentation →p. 9 — Capex, free cash flow conversion and buybacks on a trailing-twelve-month basis; repurchases roughly halved year on year. · Open the full presentation →p. 10 — The 2026 guidance table as of May: 1-3% revenue growth, ~34% margin, $8.00-$8.30 adjusted EPS. · Open the full presentation →
Fourth Quarter 2025 Financial Results — FY 2025 · 28 pages · The full-year 2025 segment results and the original 2026 guidance the Investor Day was built on top of. · Open →
Third Quarter 2025 Financial Results — 3Q 2025 · 31 pages · The reset quarter: the rebased outlook, the quarterly Clover volume table and how much of growth was Argentine inflation. · Open →
Fourth Quarter 2024 Financial Results — FY 2024 · 26 pages · The peak-expectations deck: FY24 organic growth of 16% and a 2025 plan of 10-12% growth and $10.10-$10.30 EPS. · Open →
Fourth Quarter 2023 Financial Results — FY 2023 · 24 pages · The FY2023 baseline for anyone rebuilding the segment revenue and margin history from the company's own reporting. · Open →